Cajun vs Hungarian In Labor Force | Age 35-44
COMPARE
Cajun
Hungarian
In Labor Force | Age 35-44
In Labor Force | Age 35-44 Comparison
Cajuns
Hungarians
81.5%
IN LABOR FORCE | AGE 35-44
0.0/ 100
METRIC RATING
314th/ 347
METRIC RANK
84.2%
IN LABOR FORCE | AGE 35-44
26.8/ 100
METRIC RATING
193rd/ 347
METRIC RANK
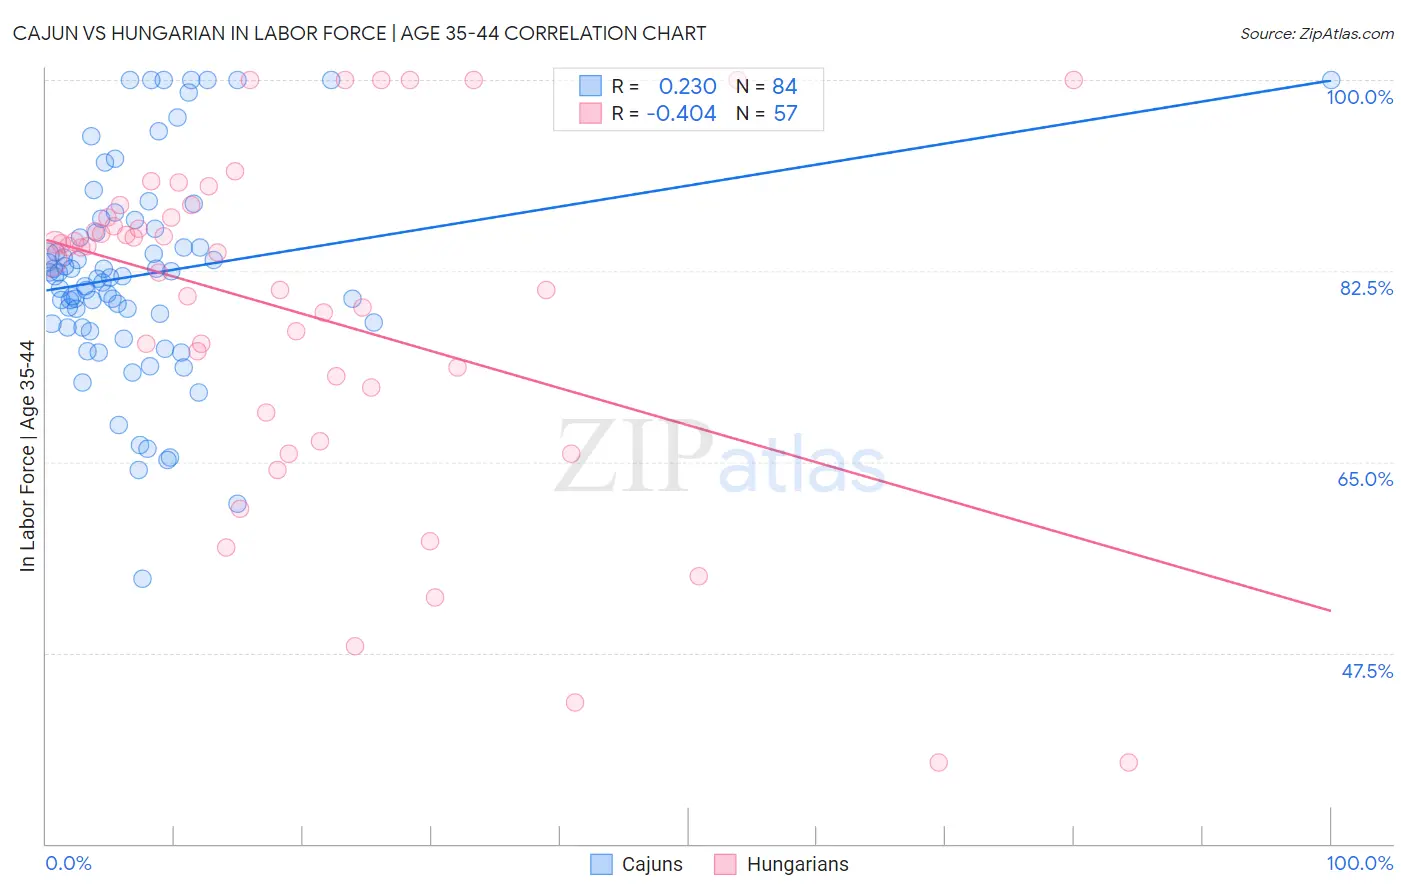
Cajun vs Hungarian In Labor Force | Age 35-44 Correlation Chart
The statistical analysis conducted on geographies consisting of 149,699,850 people shows a weak positive correlation between the proportion of Cajuns and labor force participation rate among population between the ages 35 and 44 in the United States with a correlation coefficient (R) of 0.230 and weighted average of 81.5%. Similarly, the statistical analysis conducted on geographies consisting of 485,922,886 people shows a moderate negative correlation between the proportion of Hungarians and labor force participation rate among population between the ages 35 and 44 in the United States with a correlation coefficient (R) of -0.404 and weighted average of 84.2%, a difference of 3.3%.
In Labor Force | Age 35-44 Correlation Summary
| Measurement | Cajun | Hungarian |
| Minimum | 54.3% | 37.5% |
| Maximum | 100.0% | 100.0% |
| Range | 45.7% | 62.5% |
| Mean | 82.2% | 78.6% |
| Median | 81.9% | 84.2% |
| Interquartile 25% (IQ1) | 77.5% | 70.7% |
| Interquartile 75% (IQ3) | 86.2% | 87.4% |
| Interquartile Range (IQR) | 8.7% | 16.7% |
| Standard Deviation (Sample) | 9.5% | 15.7% |
| Standard Deviation (Population) | 9.5% | 15.6% |
Similar Demographics by In Labor Force | Age 35-44
Demographics Similar to Cajuns by In Labor Force | Age 35-44
In terms of in labor force | age 35-44, the demographic groups most similar to Cajuns are Immigrants from Mexico (81.5%, a difference of 0.020%), Comanche (81.5%, a difference of 0.050%), Mexican (81.6%, a difference of 0.11%), Alaska Native (81.6%, a difference of 0.12%), and Cherokee (81.4%, a difference of 0.13%).
| Demographics | Rating | Rank | In Labor Force | Age 35-44 |
| Hispanics or Latinos | 0.0 /100 | #307 | Tragic 82.1% |
| Immigrants | Central America | 0.0 /100 | #308 | Tragic 82.0% |
| Cree | 0.0 /100 | #309 | Tragic 82.0% |
| Blackfeet | 0.0 /100 | #310 | Tragic 81.9% |
| Colville | 0.0 /100 | #311 | Tragic 81.7% |
| Alaska Natives | 0.0 /100 | #312 | Tragic 81.6% |
| Mexicans | 0.0 /100 | #313 | Tragic 81.6% |
| Cajuns | 0.0 /100 | #314 | Tragic 81.5% |
| Immigrants | Mexico | 0.0 /100 | #315 | Tragic 81.5% |
| Comanche | 0.0 /100 | #316 | Tragic 81.5% |
| Cherokee | 0.0 /100 | #317 | Tragic 81.4% |
| Alaskan Athabascans | 0.0 /100 | #318 | Tragic 81.3% |
| Inupiat | 0.0 /100 | #319 | Tragic 80.9% |
| Chickasaw | 0.0 /100 | #320 | Tragic 80.9% |
| Puerto Ricans | 0.0 /100 | #321 | Tragic 80.7% |
Demographics Similar to Hungarians by In Labor Force | Age 35-44
In terms of in labor force | age 35-44, the demographic groups most similar to Hungarians are Immigrants from Philippines (84.2%, a difference of 0.010%), Immigrants from Vietnam (84.2%, a difference of 0.010%), Immigrants from Indonesia (84.2%, a difference of 0.010%), Immigrants from Caribbean (84.2%, a difference of 0.010%), and Immigrants from England (84.2%, a difference of 0.010%).
| Demographics | Rating | Rank | In Labor Force | Age 35-44 |
| Australians | 35.1 /100 | #186 | Fair 84.3% |
| Dutch | 34.8 /100 | #187 | Fair 84.3% |
| South Africans | 34.1 /100 | #188 | Fair 84.3% |
| Immigrants | Denmark | 33.7 /100 | #189 | Fair 84.3% |
| Portuguese | 31.9 /100 | #190 | Fair 84.3% |
| Immigrants | Philippines | 27.9 /100 | #191 | Fair 84.2% |
| Immigrants | Vietnam | 27.4 /100 | #192 | Fair 84.2% |
| Hungarians | 26.8 /100 | #193 | Fair 84.2% |
| Immigrants | Indonesia | 25.7 /100 | #194 | Fair 84.2% |
| Immigrants | Caribbean | 25.7 /100 | #195 | Fair 84.2% |
| Immigrants | England | 25.0 /100 | #196 | Fair 84.2% |
| Immigrants | Western Europe | 24.7 /100 | #197 | Fair 84.2% |
| Ecuadorians | 24.0 /100 | #198 | Fair 84.2% |
| Syrians | 23.2 /100 | #199 | Fair 84.2% |
| Moroccans | 23.2 /100 | #200 | Fair 84.2% |