White/Caucasian vs Immigrants from Dominica In Labor Force | Age 20-24
COMPARE
White/Caucasian
Immigrants from Dominica
In Labor Force | Age 20-24
In Labor Force | Age 20-24 Comparison
Whites/Caucasians
Immigrants from Dominica
76.9%
IN LABOR FORCE | AGE 20-24
99.9/ 100
METRIC RATING
64th/ 347
METRIC RANK
71.9%
IN LABOR FORCE | AGE 20-24
0.0/ 100
METRIC RATING
313th/ 347
METRIC RANK
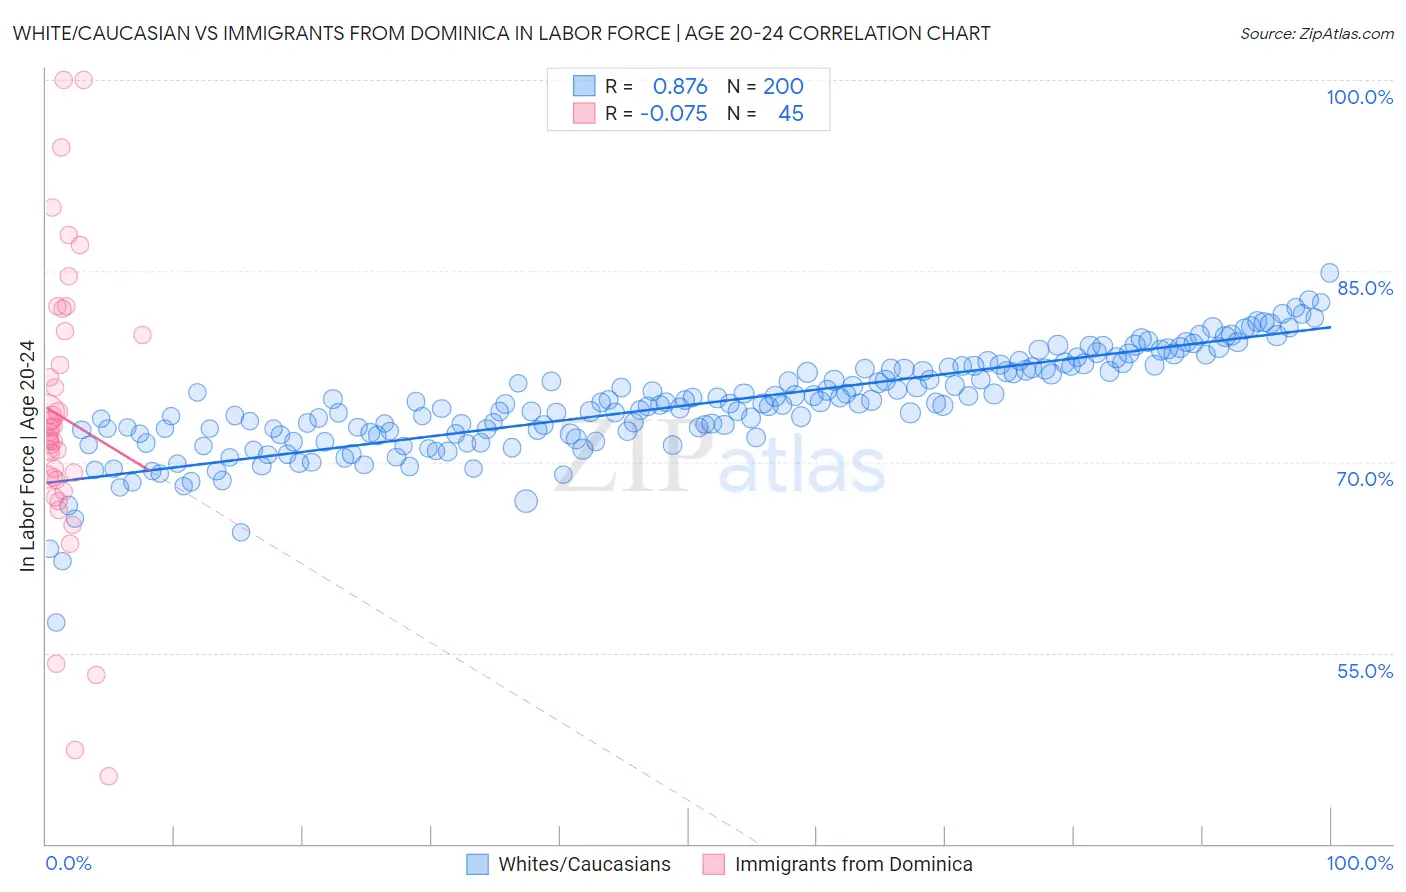
White/Caucasian vs Immigrants from Dominica In Labor Force | Age 20-24 Correlation Chart
The statistical analysis conducted on geographies consisting of 582,226,034 people shows a very strong positive correlation between the proportion of Whites/Caucasians and labor force participation rate among population between the ages 20 and 24 in the United States with a correlation coefficient (R) of 0.876 and weighted average of 76.9%. Similarly, the statistical analysis conducted on geographies consisting of 83,795,907 people shows a slight negative correlation between the proportion of Immigrants from Dominica and labor force participation rate among population between the ages 20 and 24 in the United States with a correlation coefficient (R) of -0.075 and weighted average of 71.9%, a difference of 7.0%.
In Labor Force | Age 20-24 Correlation Summary
| Measurement | White/Caucasian | Immigrants from Dominica |
| Minimum | 57.4% | 45.3% |
| Maximum | 84.8% | 100.0% |
| Range | 27.5% | 54.7% |
| Mean | 74.5% | 73.5% |
| Median | 74.5% | 72.3% |
| Interquartile 25% (IQ1) | 72.1% | 68.7% |
| Interquartile 75% (IQ3) | 77.3% | 80.1% |
| Interquartile Range (IQR) | 5.2% | 11.4% |
| Standard Deviation (Sample) | 4.0% | 11.4% |
| Standard Deviation (Population) | 4.0% | 11.3% |
Similar Demographics by In Labor Force | Age 20-24
Demographics Similar to Whites/Caucasians by In Labor Force | Age 20-24
In terms of in labor force | age 20-24, the demographic groups most similar to Whites/Caucasians are Immigrants from Kenya (77.0%, a difference of 0.040%), Lithuanian (77.0%, a difference of 0.040%), Immigrants from Eritrea (77.0%, a difference of 0.050%), Crow (76.9%, a difference of 0.050%), and Icelander (76.9%, a difference of 0.070%).
| Demographics | Rating | Rank | In Labor Force | Age 20-24 |
| Chippewa | 99.9 /100 | #57 | Exceptional 77.1% |
| Hawaiians | 99.9 /100 | #58 | Exceptional 77.0% |
| Scotch-Irish | 99.9 /100 | #59 | Exceptional 77.0% |
| Kenyans | 99.9 /100 | #60 | Exceptional 77.0% |
| Immigrants | Eritrea | 99.9 /100 | #61 | Exceptional 77.0% |
| Immigrants | Kenya | 99.9 /100 | #62 | Exceptional 77.0% |
| Lithuanians | 99.9 /100 | #63 | Exceptional 77.0% |
| Whites/Caucasians | 99.9 /100 | #64 | Exceptional 76.9% |
| Crow | 99.9 /100 | #65 | Exceptional 76.9% |
| Icelanders | 99.9 /100 | #66 | Exceptional 76.9% |
| Slavs | 99.9 /100 | #67 | Exceptional 76.9% |
| French American Indians | 99.8 /100 | #68 | Exceptional 76.8% |
| Immigrants | Sudan | 99.8 /100 | #69 | Exceptional 76.8% |
| Ottawa | 99.8 /100 | #70 | Exceptional 76.8% |
| Northern Europeans | 99.8 /100 | #71 | Exceptional 76.8% |
Demographics Similar to Immigrants from Dominica by In Labor Force | Age 20-24
In terms of in labor force | age 20-24, the demographic groups most similar to Immigrants from Dominica are Indian (Asian) (71.9%, a difference of 0.010%), Immigrants from Caribbean (71.9%, a difference of 0.050%), Immigrants from Iran (71.8%, a difference of 0.090%), Apache (72.0%, a difference of 0.12%), and Immigrants from Cuba (72.0%, a difference of 0.13%).
| Demographics | Rating | Rank | In Labor Force | Age 20-24 |
| Immigrants | Jamaica | 0.0 /100 | #306 | Tragic 72.4% |
| Immigrants | Ecuador | 0.0 /100 | #307 | Tragic 72.3% |
| Soviet Union | 0.0 /100 | #308 | Tragic 72.3% |
| Tsimshian | 0.0 /100 | #309 | Tragic 72.3% |
| Immigrants | Cuba | 0.0 /100 | #310 | Tragic 72.0% |
| Apache | 0.0 /100 | #311 | Tragic 72.0% |
| Immigrants | Caribbean | 0.0 /100 | #312 | Tragic 71.9% |
| Immigrants | Dominica | 0.0 /100 | #313 | Tragic 71.9% |
| Indians (Asian) | 0.0 /100 | #314 | Tragic 71.9% |
| Immigrants | Iran | 0.0 /100 | #315 | Tragic 71.8% |
| Immigrants | Eastern Asia | 0.0 /100 | #316 | Tragic 71.8% |
| Immigrants | Armenia | 0.0 /100 | #317 | Tragic 71.7% |
| Immigrants | Hong Kong | 0.0 /100 | #318 | Tragic 71.6% |
| Immigrants | Israel | 0.0 /100 | #319 | Tragic 71.6% |
| Trinidadians and Tobagonians | 0.0 /100 | #320 | Tragic 71.5% |