Yuman vs Immigrants from Dominica In Labor Force | Age 20-24
COMPARE
Yuman
Immigrants from Dominica
In Labor Force | Age 20-24
In Labor Force | Age 20-24 Comparison
Yuman
Immigrants from Dominica
70.3%
IN LABOR FORCE | AGE 20-24
0.0/ 100
METRIC RATING
333rd/ 347
METRIC RANK
71.9%
IN LABOR FORCE | AGE 20-24
0.0/ 100
METRIC RATING
313th/ 347
METRIC RANK
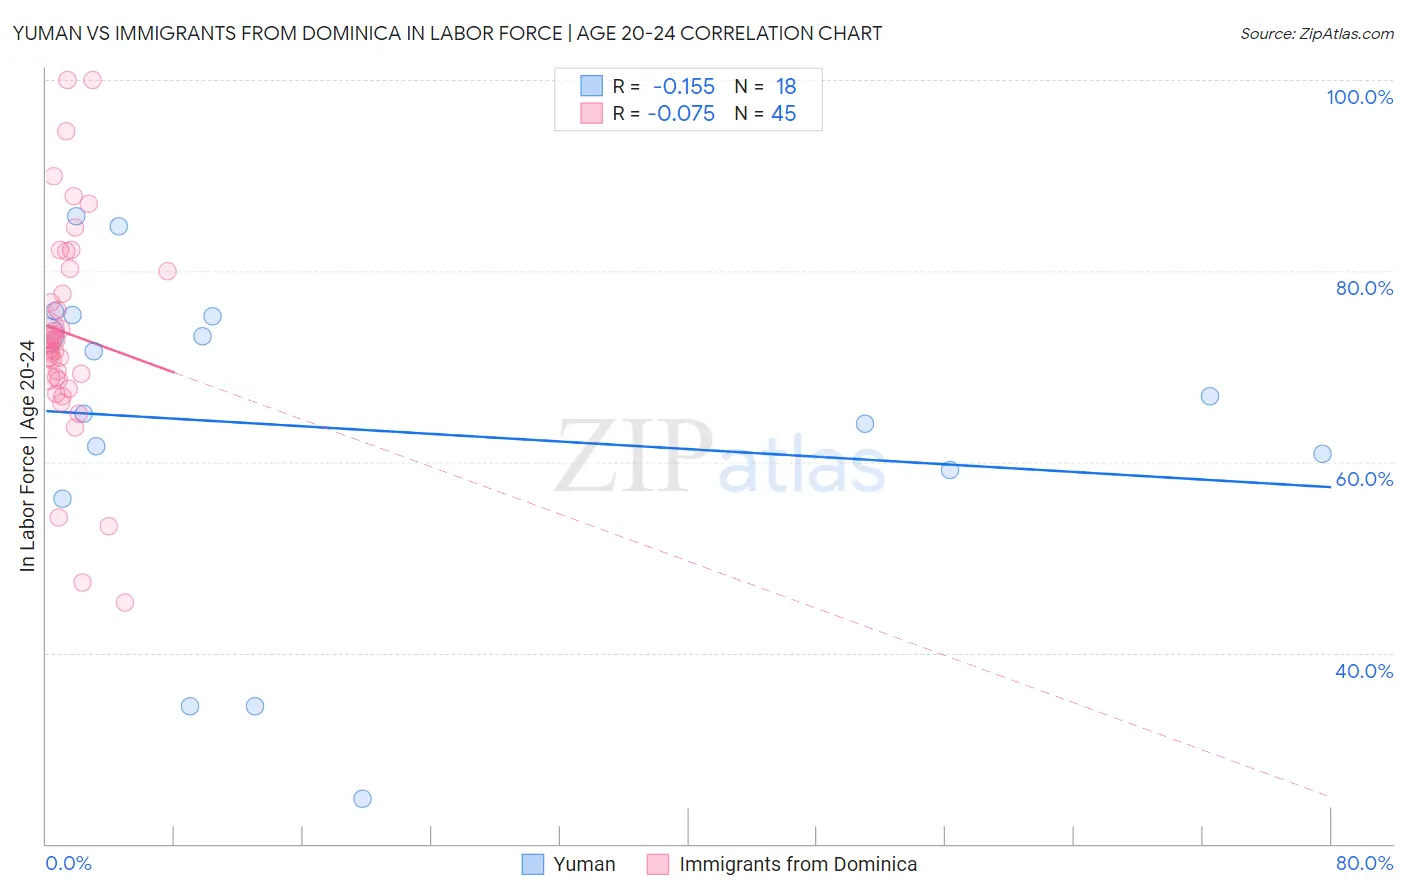
Yuman vs Immigrants from Dominica In Labor Force | Age 20-24 Correlation Chart
The statistical analysis conducted on geographies consisting of 40,677,141 people shows a poor negative correlation between the proportion of Yuman and labor force participation rate among population between the ages 20 and 24 in the United States with a correlation coefficient (R) of -0.155 and weighted average of 70.3%. Similarly, the statistical analysis conducted on geographies consisting of 83,795,907 people shows a slight negative correlation between the proportion of Immigrants from Dominica and labor force participation rate among population between the ages 20 and 24 in the United States with a correlation coefficient (R) of -0.075 and weighted average of 71.9%, a difference of 2.3%.
In Labor Force | Age 20-24 Correlation Summary
| Measurement | Yuman | Immigrants from Dominica |
| Minimum | 24.7% | 45.3% |
| Maximum | 85.7% | 100.0% |
| Range | 61.0% | 54.7% |
| Mean | 63.4% | 73.5% |
| Median | 66.0% | 72.3% |
| Interquartile 25% (IQ1) | 59.1% | 68.7% |
| Interquartile 75% (IQ3) | 75.2% | 80.1% |
| Interquartile Range (IQR) | 16.1% | 11.4% |
| Standard Deviation (Sample) | 17.0% | 11.4% |
| Standard Deviation (Population) | 16.5% | 11.3% |
Demographics Similar to Yuman and Immigrants from Dominica by In Labor Force | Age 20-24
In terms of in labor force | age 20-24, the demographic groups most similar to Yuman are Immigrants from Uzbekistan (70.4%, a difference of 0.23%), Immigrants from Bangladesh (70.6%, a difference of 0.53%), Vietnamese (70.6%, a difference of 0.55%), Yup'ik (70.9%, a difference of 0.90%), and Immigrants from China (71.1%, a difference of 1.1%). Similarly, the demographic groups most similar to Immigrants from Dominica are Indian (Asian) (71.9%, a difference of 0.010%), Immigrants from Iran (71.8%, a difference of 0.090%), Immigrants from Eastern Asia (71.8%, a difference of 0.14%), Immigrants from Armenia (71.7%, a difference of 0.31%), and Immigrants from Hong Kong (71.6%, a difference of 0.39%).
| Demographics | Rating | Rank | In Labor Force | Age 20-24 |
| Immigrants | Dominica | 0.0 /100 | #313 | Tragic 71.9% |
| Indians (Asian) | 0.0 /100 | #314 | Tragic 71.9% |
| Immigrants | Iran | 0.0 /100 | #315 | Tragic 71.8% |
| Immigrants | Eastern Asia | 0.0 /100 | #316 | Tragic 71.8% |
| Immigrants | Armenia | 0.0 /100 | #317 | Tragic 71.7% |
| Immigrants | Hong Kong | 0.0 /100 | #318 | Tragic 71.6% |
| Immigrants | Israel | 0.0 /100 | #319 | Tragic 71.6% |
| Trinidadians and Tobagonians | 0.0 /100 | #320 | Tragic 71.5% |
| Immigrants | Taiwan | 0.0 /100 | #321 | Tragic 71.5% |
| Filipinos | 0.0 /100 | #322 | Tragic 71.4% |
| West Indians | 0.0 /100 | #323 | Tragic 71.3% |
| Immigrants | Dominican Republic | 0.0 /100 | #324 | Tragic 71.2% |
| Barbadians | 0.0 /100 | #325 | Tragic 71.1% |
| Dominicans | 0.0 /100 | #326 | Tragic 71.1% |
| Immigrants | Trinidad and Tobago | 0.0 /100 | #327 | Tragic 71.1% |
| Immigrants | China | 0.0 /100 | #328 | Tragic 71.1% |
| Yup'ik | 0.0 /100 | #329 | Tragic 70.9% |
| Vietnamese | 0.0 /100 | #330 | Tragic 70.6% |
| Immigrants | Bangladesh | 0.0 /100 | #331 | Tragic 70.6% |
| Immigrants | Uzbekistan | 0.0 /100 | #332 | Tragic 70.4% |
| Yuman | 0.0 /100 | #333 | Tragic 70.3% |