Immigrants from Eastern Africa vs Immigrants from Dominica In Labor Force | Age 20-24
COMPARE
Immigrants from Eastern Africa
Immigrants from Dominica
In Labor Force | Age 20-24
In Labor Force | Age 20-24 Comparison
Immigrants from Eastern Africa
Immigrants from Dominica
77.5%
IN LABOR FORCE | AGE 20-24
100.0/ 100
METRIC RATING
35th/ 347
METRIC RANK
71.9%
IN LABOR FORCE | AGE 20-24
0.0/ 100
METRIC RATING
313th/ 347
METRIC RANK
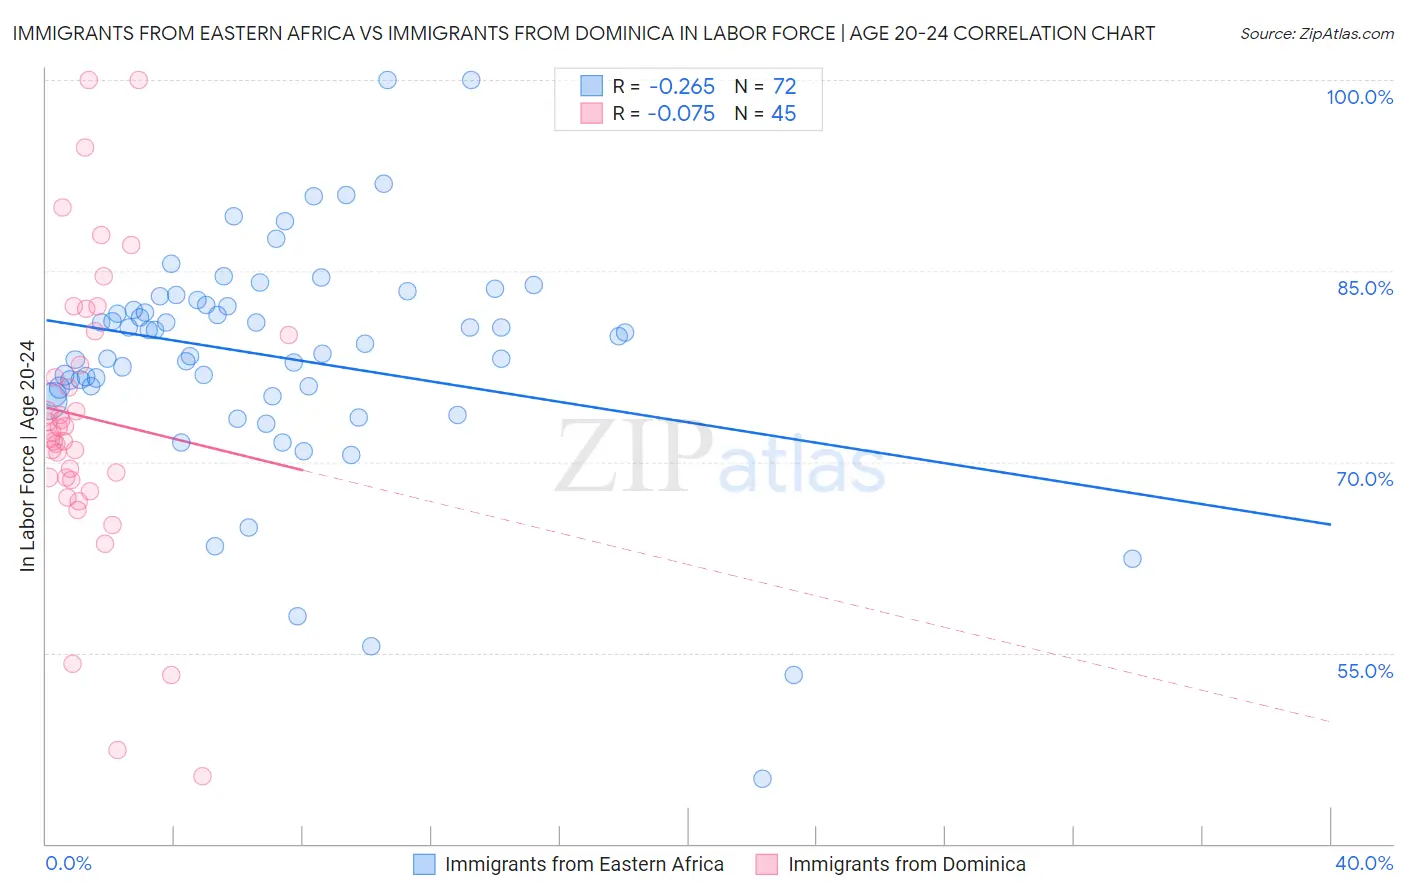
Immigrants from Eastern Africa vs Immigrants from Dominica In Labor Force | Age 20-24 Correlation Chart
The statistical analysis conducted on geographies consisting of 355,112,386 people shows a weak negative correlation between the proportion of Immigrants from Eastern Africa and labor force participation rate among population between the ages 20 and 24 in the United States with a correlation coefficient (R) of -0.265 and weighted average of 77.5%. Similarly, the statistical analysis conducted on geographies consisting of 83,795,907 people shows a slight negative correlation between the proportion of Immigrants from Dominica and labor force participation rate among population between the ages 20 and 24 in the United States with a correlation coefficient (R) of -0.075 and weighted average of 71.9%, a difference of 7.8%.
In Labor Force | Age 20-24 Correlation Summary
| Measurement | Immigrants from Eastern Africa | Immigrants from Dominica |
| Minimum | 45.1% | 45.3% |
| Maximum | 100.0% | 100.0% |
| Range | 54.9% | 54.7% |
| Mean | 78.2% | 73.5% |
| Median | 79.6% | 72.3% |
| Interquartile 25% (IQ1) | 75.6% | 68.7% |
| Interquartile 75% (IQ3) | 82.5% | 80.1% |
| Interquartile Range (IQR) | 6.9% | 11.4% |
| Standard Deviation (Sample) | 9.1% | 11.4% |
| Standard Deviation (Population) | 9.1% | 11.3% |
Similar Demographics by In Labor Force | Age 20-24
Demographics Similar to Immigrants from Eastern Africa by In Labor Force | Age 20-24
In terms of in labor force | age 20-24, the demographic groups most similar to Immigrants from Eastern Africa are German Russian (77.5%, a difference of 0.010%), Immigrants from Ethiopia (77.5%, a difference of 0.020%), Welsh (77.5%, a difference of 0.020%), Czechoslovakian (77.5%, a difference of 0.030%), and English (77.6%, a difference of 0.070%).
| Demographics | Rating | Rank | In Labor Force | Age 20-24 |
| Belgians | 100.0 /100 | #28 | Exceptional 77.8% |
| Slovaks | 100.0 /100 | #29 | Exceptional 77.7% |
| Swiss | 100.0 /100 | #30 | Exceptional 77.7% |
| Poles | 100.0 /100 | #31 | Exceptional 77.6% |
| English | 100.0 /100 | #32 | Exceptional 77.6% |
| Immigrants | Ethiopia | 100.0 /100 | #33 | Exceptional 77.5% |
| German Russians | 100.0 /100 | #34 | Exceptional 77.5% |
| Immigrants | Eastern Africa | 100.0 /100 | #35 | Exceptional 77.5% |
| Welsh | 100.0 /100 | #36 | Exceptional 77.5% |
| Czechoslovakians | 100.0 /100 | #37 | Exceptional 77.5% |
| Marshallese | 100.0 /100 | #38 | Exceptional 77.4% |
| Irish | 100.0 /100 | #39 | Exceptional 77.4% |
| Scottish | 100.0 /100 | #40 | Exceptional 77.4% |
| Immigrants | Congo | 100.0 /100 | #41 | Exceptional 77.4% |
| French | 100.0 /100 | #42 | Exceptional 77.4% |
Demographics Similar to Immigrants from Dominica by In Labor Force | Age 20-24
In terms of in labor force | age 20-24, the demographic groups most similar to Immigrants from Dominica are Indian (Asian) (71.9%, a difference of 0.010%), Immigrants from Caribbean (71.9%, a difference of 0.050%), Immigrants from Iran (71.8%, a difference of 0.090%), Apache (72.0%, a difference of 0.12%), and Immigrants from Cuba (72.0%, a difference of 0.13%).
| Demographics | Rating | Rank | In Labor Force | Age 20-24 |
| Immigrants | Jamaica | 0.0 /100 | #306 | Tragic 72.4% |
| Immigrants | Ecuador | 0.0 /100 | #307 | Tragic 72.3% |
| Soviet Union | 0.0 /100 | #308 | Tragic 72.3% |
| Tsimshian | 0.0 /100 | #309 | Tragic 72.3% |
| Immigrants | Cuba | 0.0 /100 | #310 | Tragic 72.0% |
| Apache | 0.0 /100 | #311 | Tragic 72.0% |
| Immigrants | Caribbean | 0.0 /100 | #312 | Tragic 71.9% |
| Immigrants | Dominica | 0.0 /100 | #313 | Tragic 71.9% |
| Indians (Asian) | 0.0 /100 | #314 | Tragic 71.9% |
| Immigrants | Iran | 0.0 /100 | #315 | Tragic 71.8% |
| Immigrants | Eastern Asia | 0.0 /100 | #316 | Tragic 71.8% |
| Immigrants | Armenia | 0.0 /100 | #317 | Tragic 71.7% |
| Immigrants | Hong Kong | 0.0 /100 | #318 | Tragic 71.6% |
| Immigrants | Israel | 0.0 /100 | #319 | Tragic 71.6% |
| Trinidadians and Tobagonians | 0.0 /100 | #320 | Tragic 71.5% |