White/Caucasian vs Latvian In Labor Force | Age 20-24
COMPARE
White/Caucasian
Latvian
In Labor Force | Age 20-24
In Labor Force | Age 20-24 Comparison
Whites/Caucasians
Latvians
76.9%
IN LABOR FORCE | AGE 20-24
99.9/ 100
METRIC RATING
64th/ 347
METRIC RANK
76.1%
IN LABOR FORCE | AGE 20-24
97.6/ 100
METRIC RATING
102nd/ 347
METRIC RANK
White/Caucasian vs Latvian In Labor Force | Age 20-24 Correlation Chart
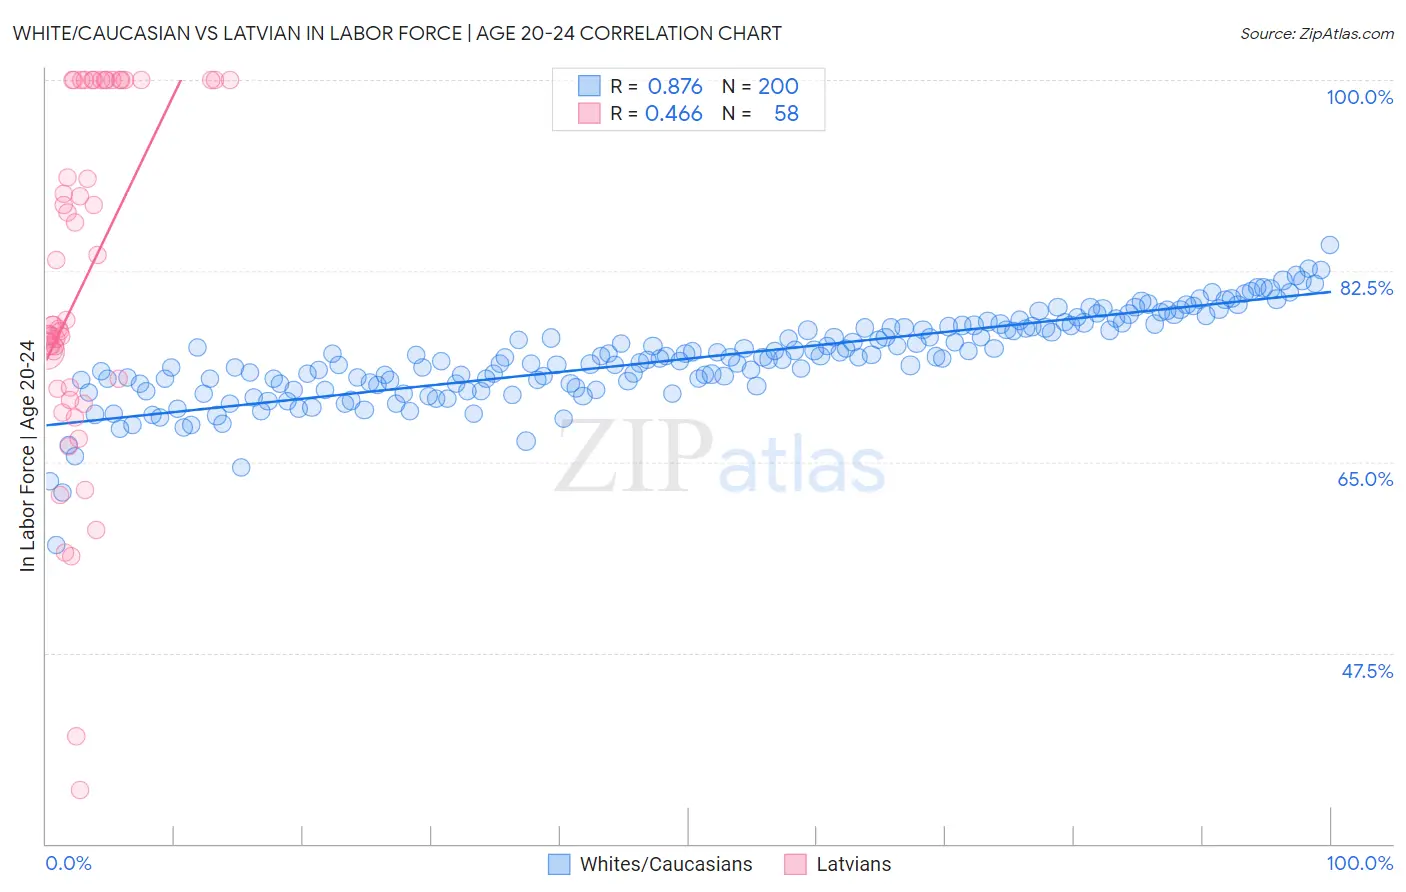
The statistical analysis conducted on geographies consisting of 582,226,034 people shows a very strong positive correlation between the proportion of Whites/Caucasians and labor force participation rate among population between the ages 20 and 24 in the United States with a correlation coefficient (R) of 0.876 and weighted average of 76.9%. Similarly, the statistical analysis conducted on geographies consisting of 220,651,647 people shows a moderate positive correlation between the proportion of Latvians and labor force participation rate among population between the ages 20 and 24 in the United States with a correlation coefficient (R) of 0.466 and weighted average of 76.1%, a difference of 1.1%.
In Labor Force | Age 20-24 Correlation Summary
| Measurement | White/Caucasian | Latvian |
| Minimum | 57.4% | 34.9% |
| Maximum | 84.8% | 100.0% |
| Range | 27.5% | 65.1% |
| Mean | 74.5% | 81.5% |
| Median | 74.5% | 77.5% |
| Interquartile 25% (IQ1) | 72.1% | 71.8% |
| Interquartile 75% (IQ3) | 77.3% | 100.0% |
| Interquartile Range (IQR) | 5.2% | 28.2% |
| Standard Deviation (Sample) | 4.0% | 15.9% |
| Standard Deviation (Population) | 4.0% | 15.7% |
Similar Demographics by In Labor Force | Age 20-24
Demographics Similar to Whites/Caucasians by In Labor Force | Age 20-24
In terms of in labor force | age 20-24, the demographic groups most similar to Whites/Caucasians are Immigrants from Kenya (77.0%, a difference of 0.040%), Lithuanian (77.0%, a difference of 0.040%), Immigrants from Eritrea (77.0%, a difference of 0.050%), Crow (76.9%, a difference of 0.050%), and Icelander (76.9%, a difference of 0.070%).
| Demographics | Rating | Rank | In Labor Force | Age 20-24 |
| Chippewa | 99.9 /100 | #57 | Exceptional 77.1% |
| Hawaiians | 99.9 /100 | #58 | Exceptional 77.0% |
| Scotch-Irish | 99.9 /100 | #59 | Exceptional 77.0% |
| Kenyans | 99.9 /100 | #60 | Exceptional 77.0% |
| Immigrants | Eritrea | 99.9 /100 | #61 | Exceptional 77.0% |
| Immigrants | Kenya | 99.9 /100 | #62 | Exceptional 77.0% |
| Lithuanians | 99.9 /100 | #63 | Exceptional 77.0% |
| Whites/Caucasians | 99.9 /100 | #64 | Exceptional 76.9% |
| Crow | 99.9 /100 | #65 | Exceptional 76.9% |
| Icelanders | 99.9 /100 | #66 | Exceptional 76.9% |
| Slavs | 99.9 /100 | #67 | Exceptional 76.9% |
| French American Indians | 99.8 /100 | #68 | Exceptional 76.8% |
| Immigrants | Sudan | 99.8 /100 | #69 | Exceptional 76.8% |
| Ottawa | 99.8 /100 | #70 | Exceptional 76.8% |
| Northern Europeans | 99.8 /100 | #71 | Exceptional 76.8% |
Demographics Similar to Latvians by In Labor Force | Age 20-24
In terms of in labor force | age 20-24, the demographic groups most similar to Latvians are Immigrants from Poland (76.1%, a difference of 0.010%), Shoshone (76.1%, a difference of 0.020%), Immigrants from North Macedonia (76.1%, a difference of 0.020%), American (76.1%, a difference of 0.030%), and Immigrants from Lithuania (76.1%, a difference of 0.060%).
| Demographics | Rating | Rank | In Labor Force | Age 20-24 |
| Immigrants | Germany | 98.5 /100 | #95 | Exceptional 76.2% |
| Immigrants | Nonimmigrants | 98.5 /100 | #96 | Exceptional 76.2% |
| Immigrants | Lithuania | 98.0 /100 | #97 | Exceptional 76.1% |
| Immigrants | Oceania | 98.0 /100 | #98 | Exceptional 76.1% |
| Americans | 97.8 /100 | #99 | Exceptional 76.1% |
| Shoshone | 97.8 /100 | #100 | Exceptional 76.1% |
| Immigrants | Poland | 97.7 /100 | #101 | Exceptional 76.1% |
| Latvians | 97.6 /100 | #102 | Exceptional 76.1% |
| Immigrants | North Macedonia | 97.5 /100 | #103 | Exceptional 76.1% |
| Macedonians | 97.2 /100 | #104 | Exceptional 76.0% |
| Immigrants | Nepal | 97.2 /100 | #105 | Exceptional 76.0% |
| Immigrants | Uganda | 97.1 /100 | #106 | Exceptional 76.0% |
| Greeks | 96.9 /100 | #107 | Exceptional 76.0% |
| Iraqis | 96.6 /100 | #108 | Exceptional 76.0% |
| Cherokee | 95.8 /100 | #109 | Exceptional 75.9% |