Immigrants from Zaire vs Immigrants from Dominica In Labor Force | Age 20-24
COMPARE
Immigrants from Zaire
Immigrants from Dominica
In Labor Force | Age 20-24
In Labor Force | Age 20-24 Comparison
Immigrants from Zaire
Immigrants from Dominica
76.6%
IN LABOR FORCE | AGE 20-24
99.6/ 100
METRIC RATING
79th/ 347
METRIC RANK
71.9%
IN LABOR FORCE | AGE 20-24
0.0/ 100
METRIC RATING
313th/ 347
METRIC RANK
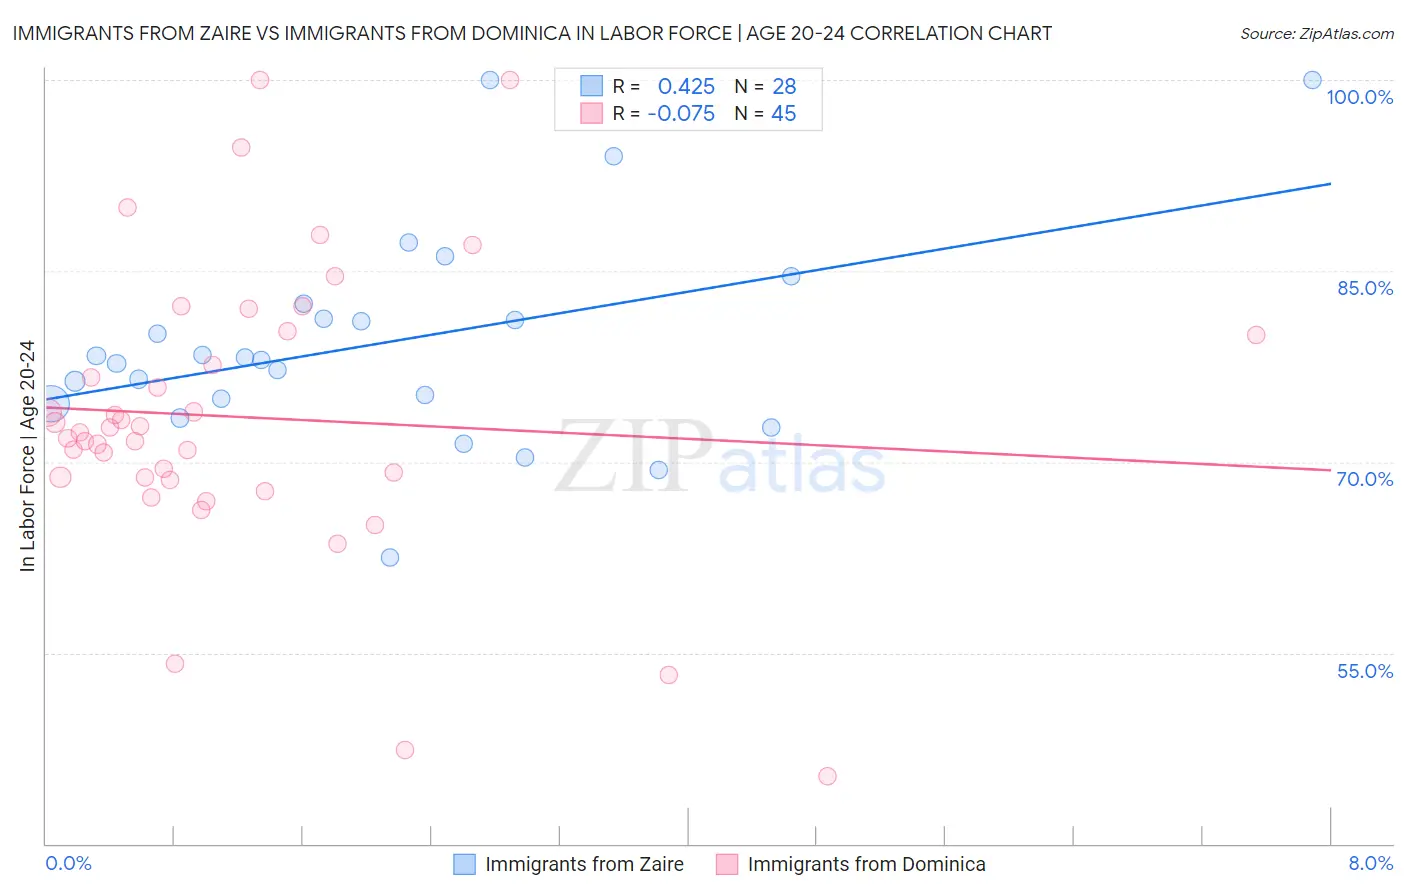
Immigrants from Zaire vs Immigrants from Dominica In Labor Force | Age 20-24 Correlation Chart
The statistical analysis conducted on geographies consisting of 107,224,188 people shows a moderate positive correlation between the proportion of Immigrants from Zaire and labor force participation rate among population between the ages 20 and 24 in the United States with a correlation coefficient (R) of 0.425 and weighted average of 76.6%. Similarly, the statistical analysis conducted on geographies consisting of 83,795,907 people shows a slight negative correlation between the proportion of Immigrants from Dominica and labor force participation rate among population between the ages 20 and 24 in the United States with a correlation coefficient (R) of -0.075 and weighted average of 71.9%, a difference of 6.5%.
In Labor Force | Age 20-24 Correlation Summary
| Measurement | Immigrants from Zaire | Immigrants from Dominica |
| Minimum | 62.5% | 45.3% |
| Maximum | 100.0% | 100.0% |
| Range | 37.5% | 54.7% |
| Mean | 79.4% | 73.5% |
| Median | 78.1% | 72.3% |
| Interquartile 25% (IQ1) | 74.7% | 68.7% |
| Interquartile 75% (IQ3) | 81.8% | 80.1% |
| Interquartile Range (IQR) | 7.1% | 11.4% |
| Standard Deviation (Sample) | 8.4% | 11.4% |
| Standard Deviation (Population) | 8.3% | 11.3% |
Similar Demographics by In Labor Force | Age 20-24
Demographics Similar to Immigrants from Zaire by In Labor Force | Age 20-24
In terms of in labor force | age 20-24, the demographic groups most similar to Immigrants from Zaire are Immigrants from Cameroon (76.6%, a difference of 0.020%), Canadian (76.6%, a difference of 0.020%), Italian (76.5%, a difference of 0.030%), Basque (76.5%, a difference of 0.040%), and Hmong (76.5%, a difference of 0.040%).
| Demographics | Rating | Rank | In Labor Force | Age 20-24 |
| Guamanians/Chamorros | 99.8 /100 | #72 | Exceptional 76.7% |
| British | 99.8 /100 | #73 | Exceptional 76.7% |
| Cree | 99.7 /100 | #74 | Exceptional 76.6% |
| Immigrants | Middle Africa | 99.7 /100 | #75 | Exceptional 76.6% |
| Immigrants | Moldova | 99.6 /100 | #76 | Exceptional 76.6% |
| Immigrants | Cameroon | 99.6 /100 | #77 | Exceptional 76.6% |
| Canadians | 99.6 /100 | #78 | Exceptional 76.6% |
| Immigrants | Zaire | 99.6 /100 | #79 | Exceptional 76.6% |
| Italians | 99.6 /100 | #80 | Exceptional 76.5% |
| Basques | 99.5 /100 | #81 | Exceptional 76.5% |
| Hmong | 99.5 /100 | #82 | Exceptional 76.5% |
| Carpatho Rusyns | 99.4 /100 | #83 | Exceptional 76.5% |
| Austrians | 99.4 /100 | #84 | Exceptional 76.5% |
| Portuguese | 99.3 /100 | #85 | Exceptional 76.4% |
| Immigrants | Iraq | 99.3 /100 | #86 | Exceptional 76.4% |
Demographics Similar to Immigrants from Dominica by In Labor Force | Age 20-24
In terms of in labor force | age 20-24, the demographic groups most similar to Immigrants from Dominica are Indian (Asian) (71.9%, a difference of 0.010%), Immigrants from Caribbean (71.9%, a difference of 0.050%), Immigrants from Iran (71.8%, a difference of 0.090%), Apache (72.0%, a difference of 0.12%), and Immigrants from Cuba (72.0%, a difference of 0.13%).
| Demographics | Rating | Rank | In Labor Force | Age 20-24 |
| Immigrants | Jamaica | 0.0 /100 | #306 | Tragic 72.4% |
| Immigrants | Ecuador | 0.0 /100 | #307 | Tragic 72.3% |
| Soviet Union | 0.0 /100 | #308 | Tragic 72.3% |
| Tsimshian | 0.0 /100 | #309 | Tragic 72.3% |
| Immigrants | Cuba | 0.0 /100 | #310 | Tragic 72.0% |
| Apache | 0.0 /100 | #311 | Tragic 72.0% |
| Immigrants | Caribbean | 0.0 /100 | #312 | Tragic 71.9% |
| Immigrants | Dominica | 0.0 /100 | #313 | Tragic 71.9% |
| Indians (Asian) | 0.0 /100 | #314 | Tragic 71.9% |
| Immigrants | Iran | 0.0 /100 | #315 | Tragic 71.8% |
| Immigrants | Eastern Asia | 0.0 /100 | #316 | Tragic 71.8% |
| Immigrants | Armenia | 0.0 /100 | #317 | Tragic 71.7% |
| Immigrants | Hong Kong | 0.0 /100 | #318 | Tragic 71.6% |
| Immigrants | Israel | 0.0 /100 | #319 | Tragic 71.6% |
| Trinidadians and Tobagonians | 0.0 /100 | #320 | Tragic 71.5% |