White/Caucasian vs English In Labor Force | Age 20-24
COMPARE
White/Caucasian
English
In Labor Force | Age 20-24
In Labor Force | Age 20-24 Comparison
Whites/Caucasians
English
76.9%
IN LABOR FORCE | AGE 20-24
99.9/ 100
METRIC RATING
64th/ 347
METRIC RANK
77.6%
IN LABOR FORCE | AGE 20-24
100.0/ 100
METRIC RATING
32nd/ 347
METRIC RANK
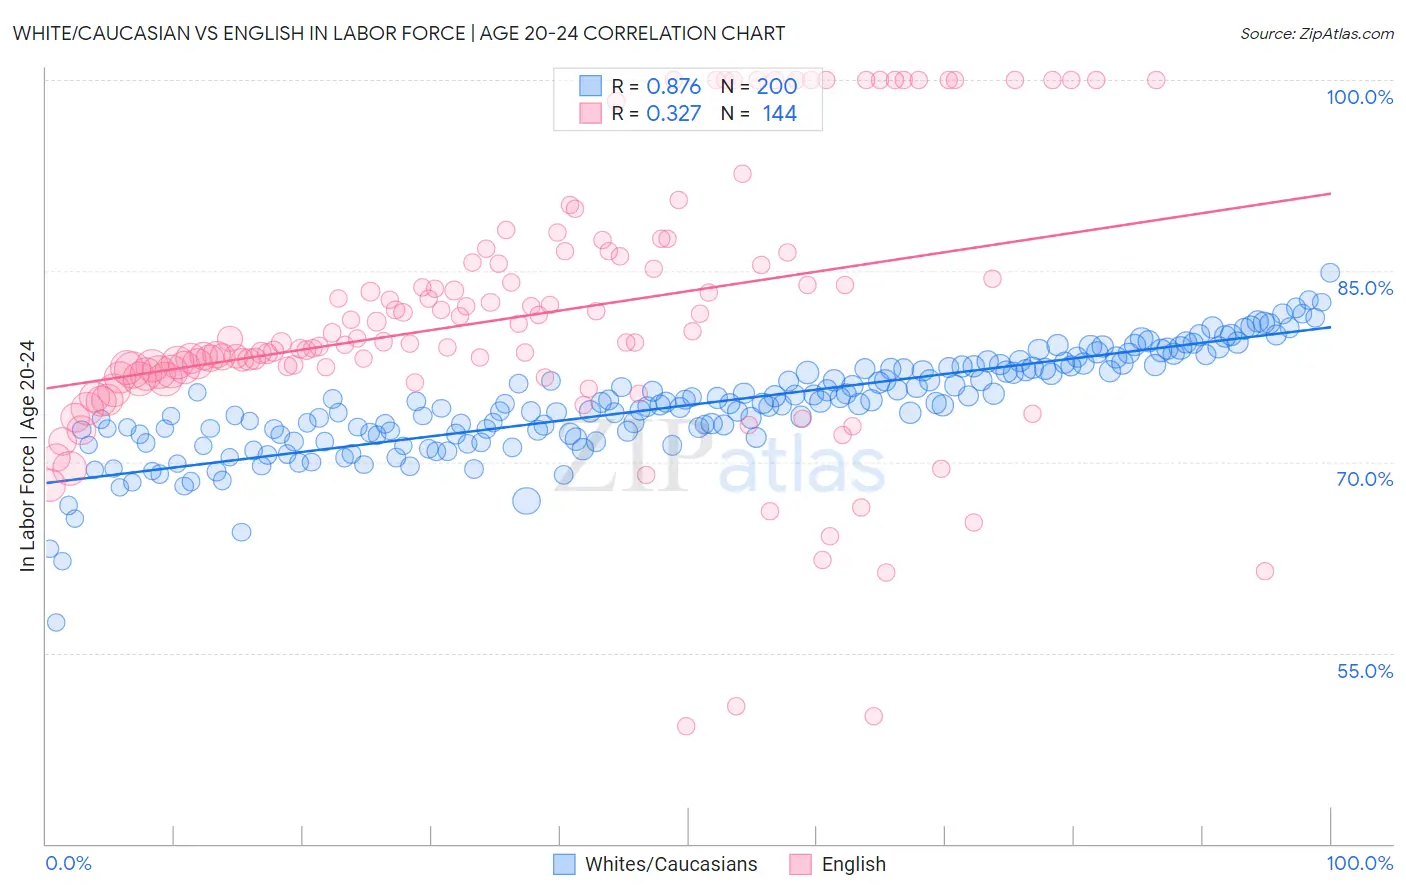
White/Caucasian vs English In Labor Force | Age 20-24 Correlation Chart
The statistical analysis conducted on geographies consisting of 582,226,034 people shows a very strong positive correlation between the proportion of Whites/Caucasians and labor force participation rate among population between the ages 20 and 24 in the United States with a correlation coefficient (R) of 0.876 and weighted average of 76.9%. Similarly, the statistical analysis conducted on geographies consisting of 577,480,929 people shows a mild positive correlation between the proportion of English and labor force participation rate among population between the ages 20 and 24 in the United States with a correlation coefficient (R) of 0.327 and weighted average of 77.6%, a difference of 0.83%.
In Labor Force | Age 20-24 Correlation Summary
| Measurement | White/Caucasian | English |
| Minimum | 57.4% | 49.2% |
| Maximum | 84.8% | 100.0% |
| Range | 27.5% | 50.8% |
| Mean | 74.5% | 81.4% |
| Median | 74.5% | 79.4% |
| Interquartile 25% (IQ1) | 72.1% | 76.8% |
| Interquartile 75% (IQ3) | 77.3% | 85.9% |
| Interquartile Range (IQR) | 5.2% | 9.1% |
| Standard Deviation (Sample) | 4.0% | 10.5% |
| Standard Deviation (Population) | 4.0% | 10.4% |
Similar Demographics by In Labor Force | Age 20-24
Demographics Similar to Whites/Caucasians by In Labor Force | Age 20-24
In terms of in labor force | age 20-24, the demographic groups most similar to Whites/Caucasians are Immigrants from Kenya (77.0%, a difference of 0.040%), Lithuanian (77.0%, a difference of 0.040%), Immigrants from Eritrea (77.0%, a difference of 0.050%), Crow (76.9%, a difference of 0.050%), and Icelander (76.9%, a difference of 0.070%).
| Demographics | Rating | Rank | In Labor Force | Age 20-24 |
| Chippewa | 99.9 /100 | #57 | Exceptional 77.1% |
| Hawaiians | 99.9 /100 | #58 | Exceptional 77.0% |
| Scotch-Irish | 99.9 /100 | #59 | Exceptional 77.0% |
| Kenyans | 99.9 /100 | #60 | Exceptional 77.0% |
| Immigrants | Eritrea | 99.9 /100 | #61 | Exceptional 77.0% |
| Immigrants | Kenya | 99.9 /100 | #62 | Exceptional 77.0% |
| Lithuanians | 99.9 /100 | #63 | Exceptional 77.0% |
| Whites/Caucasians | 99.9 /100 | #64 | Exceptional 76.9% |
| Crow | 99.9 /100 | #65 | Exceptional 76.9% |
| Icelanders | 99.9 /100 | #66 | Exceptional 76.9% |
| Slavs | 99.9 /100 | #67 | Exceptional 76.9% |
| French American Indians | 99.8 /100 | #68 | Exceptional 76.8% |
| Immigrants | Sudan | 99.8 /100 | #69 | Exceptional 76.8% |
| Ottawa | 99.8 /100 | #70 | Exceptional 76.8% |
| Northern Europeans | 99.8 /100 | #71 | Exceptional 76.8% |
Demographics Similar to English by In Labor Force | Age 20-24
In terms of in labor force | age 20-24, the demographic groups most similar to English are Immigrants from Ethiopia (77.5%, a difference of 0.050%), German Russian (77.5%, a difference of 0.050%), Polish (77.6%, a difference of 0.060%), Immigrants from Eastern Africa (77.5%, a difference of 0.070%), and Welsh (77.5%, a difference of 0.090%).
| Demographics | Rating | Rank | In Labor Force | Age 20-24 |
| Tlingit-Haida | 100.0 /100 | #25 | Exceptional 77.9% |
| Tongans | 100.0 /100 | #26 | Exceptional 77.9% |
| Immigrants | Micronesia | 100.0 /100 | #27 | Exceptional 77.8% |
| Belgians | 100.0 /100 | #28 | Exceptional 77.8% |
| Slovaks | 100.0 /100 | #29 | Exceptional 77.7% |
| Swiss | 100.0 /100 | #30 | Exceptional 77.7% |
| Poles | 100.0 /100 | #31 | Exceptional 77.6% |
| English | 100.0 /100 | #32 | Exceptional 77.6% |
| Immigrants | Ethiopia | 100.0 /100 | #33 | Exceptional 77.5% |
| German Russians | 100.0 /100 | #34 | Exceptional 77.5% |
| Immigrants | Eastern Africa | 100.0 /100 | #35 | Exceptional 77.5% |
| Welsh | 100.0 /100 | #36 | Exceptional 77.5% |
| Czechoslovakians | 100.0 /100 | #37 | Exceptional 77.5% |
| Marshallese | 100.0 /100 | #38 | Exceptional 77.4% |
| Irish | 100.0 /100 | #39 | Exceptional 77.4% |