White/Caucasian vs Portuguese In Labor Force | Age 20-24
COMPARE
White/Caucasian
Portuguese
In Labor Force | Age 20-24
In Labor Force | Age 20-24 Comparison
Whites/Caucasians
Portuguese
76.9%
IN LABOR FORCE | AGE 20-24
99.9/ 100
METRIC RATING
64th/ 347
METRIC RANK
76.4%
IN LABOR FORCE | AGE 20-24
99.3/ 100
METRIC RATING
85th/ 347
METRIC RANK
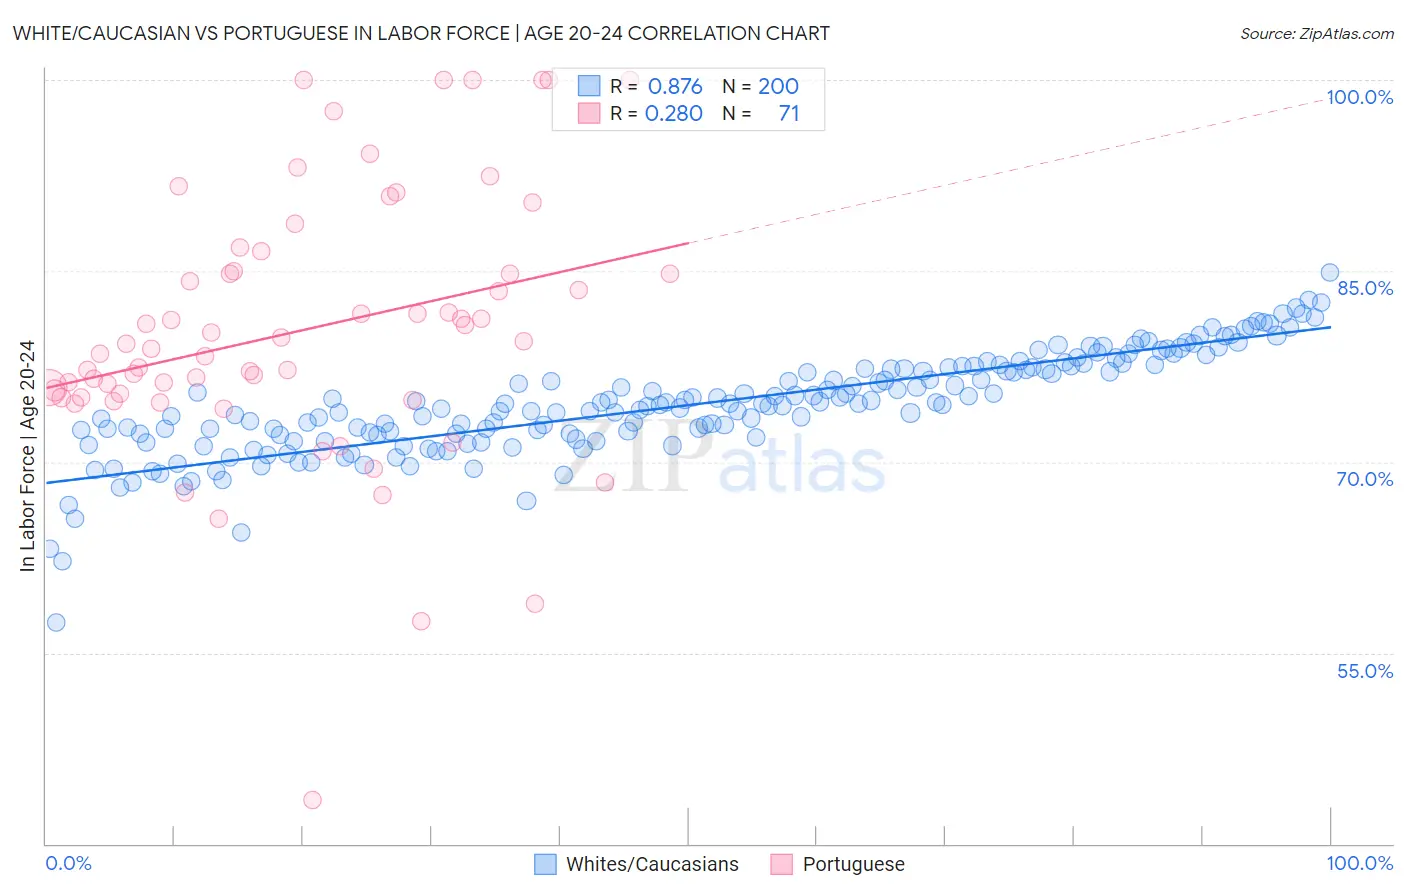
White/Caucasian vs Portuguese In Labor Force | Age 20-24 Correlation Chart
The statistical analysis conducted on geographies consisting of 582,226,034 people shows a very strong positive correlation between the proportion of Whites/Caucasians and labor force participation rate among population between the ages 20 and 24 in the United States with a correlation coefficient (R) of 0.876 and weighted average of 76.9%. Similarly, the statistical analysis conducted on geographies consisting of 449,964,136 people shows a weak positive correlation between the proportion of Portuguese and labor force participation rate among population between the ages 20 and 24 in the United States with a correlation coefficient (R) of 0.280 and weighted average of 76.4%, a difference of 0.65%.
In Labor Force | Age 20-24 Correlation Summary
| Measurement | White/Caucasian | Portuguese |
| Minimum | 57.4% | 43.4% |
| Maximum | 84.8% | 100.0% |
| Range | 27.5% | 56.6% |
| Mean | 74.5% | 80.3% |
| Median | 74.5% | 79.3% |
| Interquartile 25% (IQ1) | 72.1% | 75.0% |
| Interquartile 75% (IQ3) | 77.3% | 85.0% |
| Interquartile Range (IQR) | 5.2% | 10.0% |
| Standard Deviation (Sample) | 4.0% | 10.5% |
| Standard Deviation (Population) | 4.0% | 10.4% |
Similar Demographics by In Labor Force | Age 20-24
Demographics Similar to Whites/Caucasians by In Labor Force | Age 20-24
In terms of in labor force | age 20-24, the demographic groups most similar to Whites/Caucasians are Immigrants from Kenya (77.0%, a difference of 0.040%), Lithuanian (77.0%, a difference of 0.040%), Immigrants from Eritrea (77.0%, a difference of 0.050%), Crow (76.9%, a difference of 0.050%), and Icelander (76.9%, a difference of 0.070%).
| Demographics | Rating | Rank | In Labor Force | Age 20-24 |
| Chippewa | 99.9 /100 | #57 | Exceptional 77.1% |
| Hawaiians | 99.9 /100 | #58 | Exceptional 77.0% |
| Scotch-Irish | 99.9 /100 | #59 | Exceptional 77.0% |
| Kenyans | 99.9 /100 | #60 | Exceptional 77.0% |
| Immigrants | Eritrea | 99.9 /100 | #61 | Exceptional 77.0% |
| Immigrants | Kenya | 99.9 /100 | #62 | Exceptional 77.0% |
| Lithuanians | 99.9 /100 | #63 | Exceptional 77.0% |
| Whites/Caucasians | 99.9 /100 | #64 | Exceptional 76.9% |
| Crow | 99.9 /100 | #65 | Exceptional 76.9% |
| Icelanders | 99.9 /100 | #66 | Exceptional 76.9% |
| Slavs | 99.9 /100 | #67 | Exceptional 76.9% |
| French American Indians | 99.8 /100 | #68 | Exceptional 76.8% |
| Immigrants | Sudan | 99.8 /100 | #69 | Exceptional 76.8% |
| Ottawa | 99.8 /100 | #70 | Exceptional 76.8% |
| Northern Europeans | 99.8 /100 | #71 | Exceptional 76.8% |
Demographics Similar to Portuguese by In Labor Force | Age 20-24
In terms of in labor force | age 20-24, the demographic groups most similar to Portuguese are Austrian (76.5%, a difference of 0.030%), Immigrants from Iraq (76.4%, a difference of 0.030%), Immigrants from Thailand (76.4%, a difference of 0.030%), Carpatho Rusyn (76.5%, a difference of 0.040%), and Spanish (76.4%, a difference of 0.070%).
| Demographics | Rating | Rank | In Labor Force | Age 20-24 |
| Canadians | 99.6 /100 | #78 | Exceptional 76.6% |
| Immigrants | Zaire | 99.6 /100 | #79 | Exceptional 76.6% |
| Italians | 99.6 /100 | #80 | Exceptional 76.5% |
| Basques | 99.5 /100 | #81 | Exceptional 76.5% |
| Hmong | 99.5 /100 | #82 | Exceptional 76.5% |
| Carpatho Rusyns | 99.4 /100 | #83 | Exceptional 76.5% |
| Austrians | 99.4 /100 | #84 | Exceptional 76.5% |
| Portuguese | 99.3 /100 | #85 | Exceptional 76.4% |
| Immigrants | Iraq | 99.3 /100 | #86 | Exceptional 76.4% |
| Immigrants | Thailand | 99.3 /100 | #87 | Exceptional 76.4% |
| Spanish | 99.2 /100 | #88 | Exceptional 76.4% |
| Bulgarians | 99.2 /100 | #89 | Exceptional 76.4% |
| Immigrants | Burma/Myanmar | 99.1 /100 | #90 | Exceptional 76.3% |
| Sierra Leoneans | 99.0 /100 | #91 | Exceptional 76.3% |
| Maltese | 98.9 /100 | #92 | Exceptional 76.3% |