Puerto Rican vs Immigrants from Dominica In Labor Force | Age 20-24
COMPARE
Puerto Rican
Immigrants from Dominica
In Labor Force | Age 20-24
In Labor Force | Age 20-24 Comparison
Puerto Ricans
Immigrants from Dominica
68.3%
IN LABOR FORCE | AGE 20-24
0.0/ 100
METRIC RATING
343rd/ 347
METRIC RANK
71.9%
IN LABOR FORCE | AGE 20-24
0.0/ 100
METRIC RATING
313th/ 347
METRIC RANK
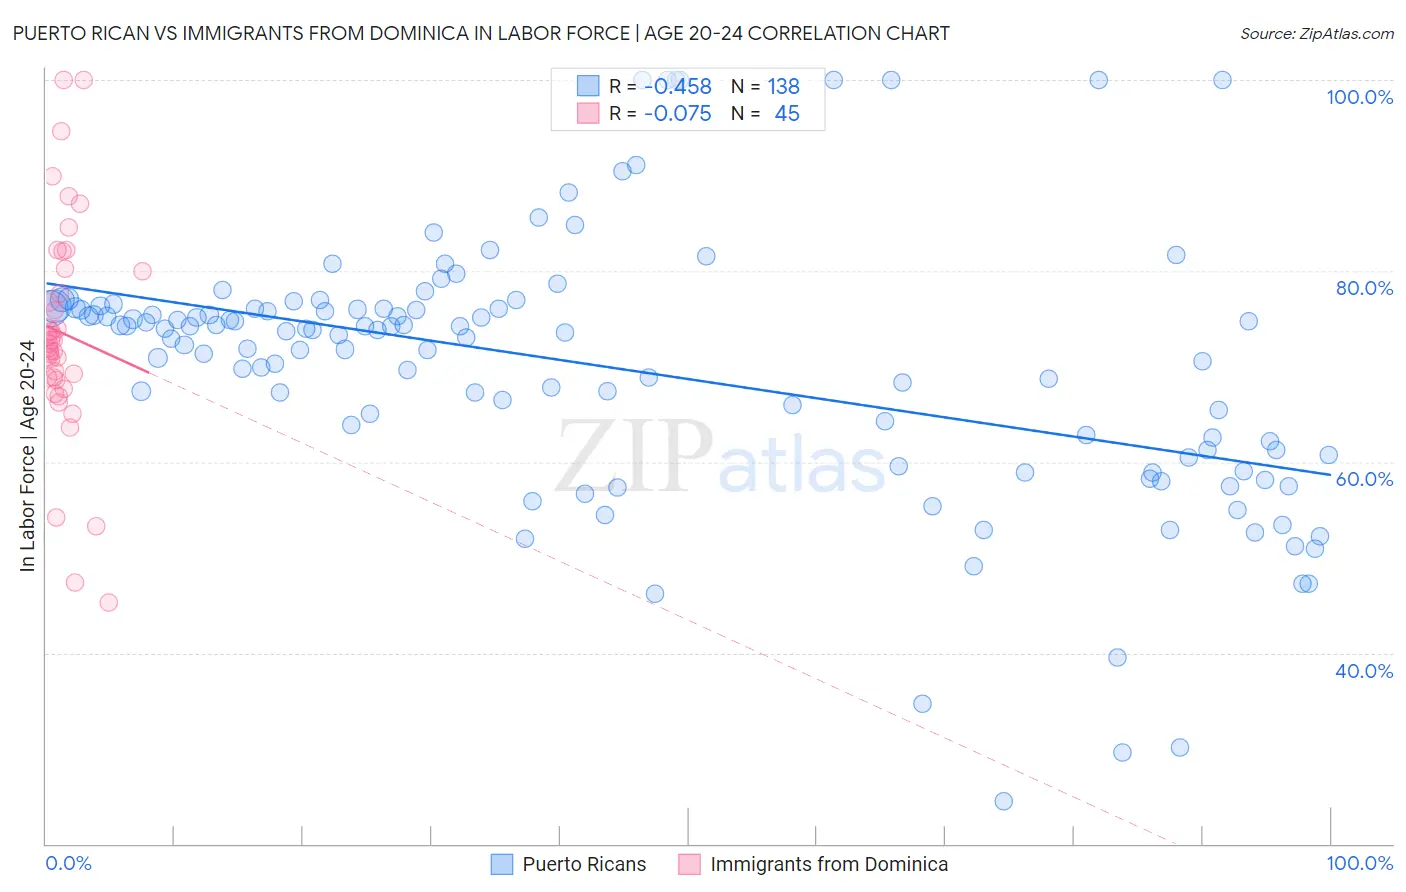
Puerto Rican vs Immigrants from Dominica In Labor Force | Age 20-24 Correlation Chart
The statistical analysis conducted on geographies consisting of 527,810,286 people shows a moderate negative correlation between the proportion of Puerto Ricans and labor force participation rate among population between the ages 20 and 24 in the United States with a correlation coefficient (R) of -0.458 and weighted average of 68.3%. Similarly, the statistical analysis conducted on geographies consisting of 83,795,907 people shows a slight negative correlation between the proportion of Immigrants from Dominica and labor force participation rate among population between the ages 20 and 24 in the United States with a correlation coefficient (R) of -0.075 and weighted average of 71.9%, a difference of 5.2%.
In Labor Force | Age 20-24 Correlation Summary
| Measurement | Puerto Rican | Immigrants from Dominica |
| Minimum | 24.4% | 45.3% |
| Maximum | 100.0% | 100.0% |
| Range | 75.6% | 54.7% |
| Mean | 69.9% | 73.5% |
| Median | 73.6% | 72.3% |
| Interquartile 25% (IQ1) | 61.2% | 68.7% |
| Interquartile 75% (IQ3) | 76.1% | 80.1% |
| Interquartile Range (IQR) | 14.9% | 11.4% |
| Standard Deviation (Sample) | 13.9% | 11.4% |
| Standard Deviation (Population) | 13.9% | 11.3% |
Similar Demographics by In Labor Force | Age 20-24
Demographics Similar to Puerto Ricans by In Labor Force | Age 20-24
In terms of in labor force | age 20-24, the demographic groups most similar to Puerto Ricans are Immigrants from St. Vincent and the Grenadines (68.4%, a difference of 0.12%), Tohono O'odham (68.6%, a difference of 0.43%), Menominee (68.7%, a difference of 0.56%), Immigrants from Yemen (68.9%, a difference of 0.87%), and Pima (69.0%, a difference of 1.0%).
| Demographics | Rating | Rank | In Labor Force | Age 20-24 |
| Yuman | 0.0 /100 | #333 | Tragic 70.3% |
| British West Indians | 0.0 /100 | #334 | Tragic 70.0% |
| Immigrants | Barbados | 0.0 /100 | #335 | Tragic 69.7% |
| Immigrants | Guyana | 0.0 /100 | #336 | Tragic 69.3% |
| Guyanese | 0.0 /100 | #337 | Tragic 69.2% |
| Pima | 0.0 /100 | #338 | Tragic 69.0% |
| Immigrants | Yemen | 0.0 /100 | #339 | Tragic 68.9% |
| Menominee | 0.0 /100 | #340 | Tragic 68.7% |
| Tohono O'odham | 0.0 /100 | #341 | Tragic 68.6% |
| Immigrants | St. Vincent and the Grenadines | 0.0 /100 | #342 | Tragic 68.4% |
| Puerto Ricans | 0.0 /100 | #343 | Tragic 68.3% |
| Immigrants | Grenada | 0.0 /100 | #344 | Tragic 67.2% |
| Hopi | 0.0 /100 | #345 | Tragic 66.0% |
| Lumbee | 0.0 /100 | #346 | Tragic 65.5% |
| Navajo | 0.0 /100 | #347 | Tragic 64.8% |
Demographics Similar to Immigrants from Dominica by In Labor Force | Age 20-24
In terms of in labor force | age 20-24, the demographic groups most similar to Immigrants from Dominica are Indian (Asian) (71.9%, a difference of 0.010%), Immigrants from Caribbean (71.9%, a difference of 0.050%), Immigrants from Iran (71.8%, a difference of 0.090%), Apache (72.0%, a difference of 0.12%), and Immigrants from Cuba (72.0%, a difference of 0.13%).
| Demographics | Rating | Rank | In Labor Force | Age 20-24 |
| Immigrants | Jamaica | 0.0 /100 | #306 | Tragic 72.4% |
| Immigrants | Ecuador | 0.0 /100 | #307 | Tragic 72.3% |
| Soviet Union | 0.0 /100 | #308 | Tragic 72.3% |
| Tsimshian | 0.0 /100 | #309 | Tragic 72.3% |
| Immigrants | Cuba | 0.0 /100 | #310 | Tragic 72.0% |
| Apache | 0.0 /100 | #311 | Tragic 72.0% |
| Immigrants | Caribbean | 0.0 /100 | #312 | Tragic 71.9% |
| Immigrants | Dominica | 0.0 /100 | #313 | Tragic 71.9% |
| Indians (Asian) | 0.0 /100 | #314 | Tragic 71.9% |
| Immigrants | Iran | 0.0 /100 | #315 | Tragic 71.8% |
| Immigrants | Eastern Asia | 0.0 /100 | #316 | Tragic 71.8% |
| Immigrants | Armenia | 0.0 /100 | #317 | Tragic 71.7% |
| Immigrants | Hong Kong | 0.0 /100 | #318 | Tragic 71.6% |
| Immigrants | Israel | 0.0 /100 | #319 | Tragic 71.6% |
| Trinidadians and Tobagonians | 0.0 /100 | #320 | Tragic 71.5% |