Immigrants from Belarus vs Immigrants from Nicaragua In Labor Force | Age 35-44
COMPARE
Immigrants from Belarus
Immigrants from Nicaragua
In Labor Force | Age 35-44
In Labor Force | Age 35-44 Comparison
Immigrants from Belarus
Immigrants from Nicaragua
84.8%
IN LABOR FORCE | AGE 35-44
95.3/ 100
METRIC RATING
103rd/ 347
METRIC RANK
84.1%
IN LABOR FORCE | AGE 35-44
9.4/ 100
METRIC RATING
218th/ 347
METRIC RANK
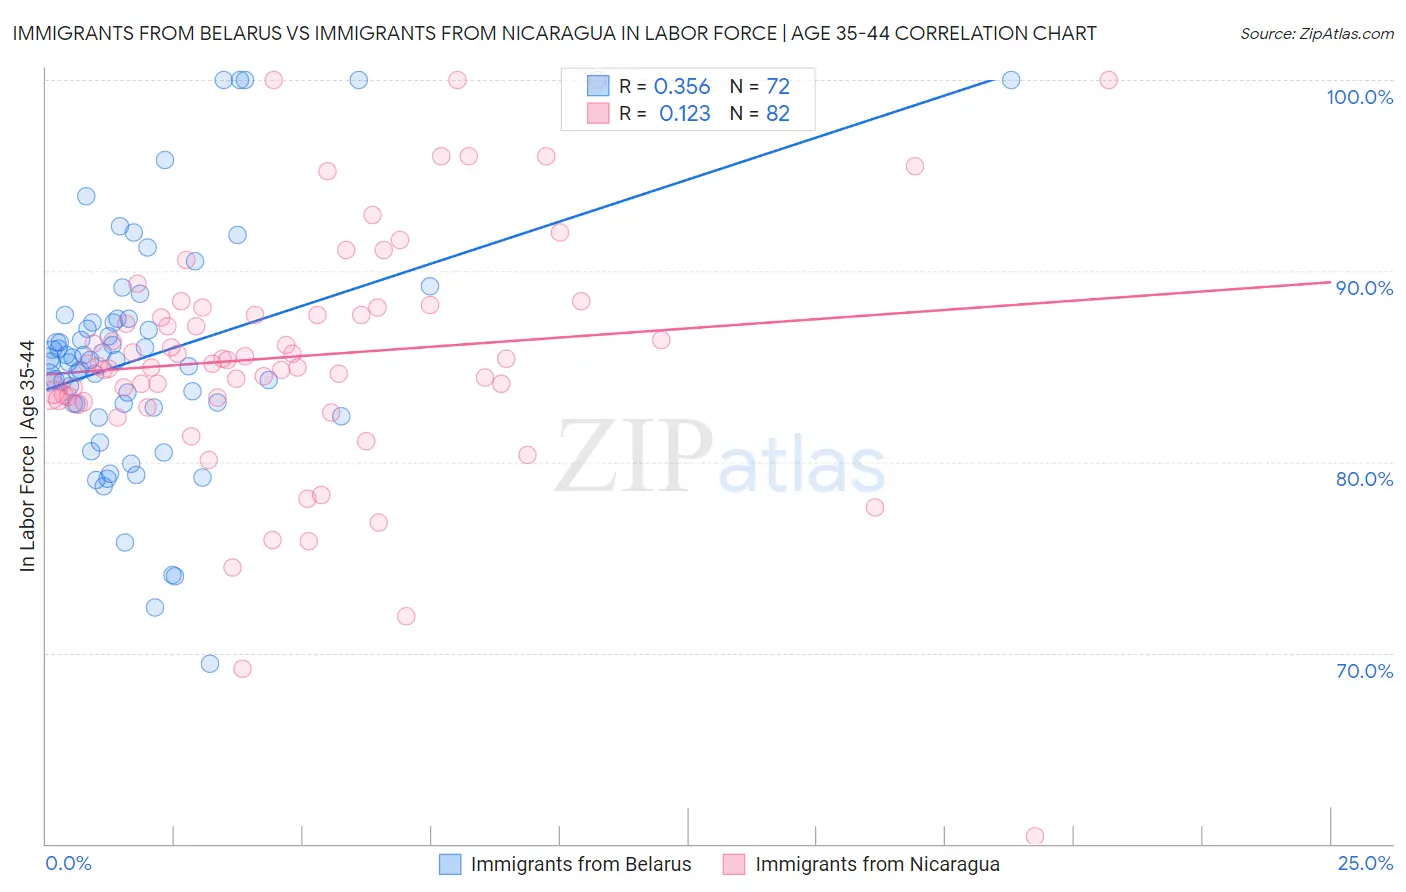
Immigrants from Belarus vs Immigrants from Nicaragua In Labor Force | Age 35-44 Correlation Chart
The statistical analysis conducted on geographies consisting of 150,195,638 people shows a mild positive correlation between the proportion of Immigrants from Belarus and labor force participation rate among population between the ages 35 and 44 in the United States with a correlation coefficient (R) of 0.356 and weighted average of 84.8%. Similarly, the statistical analysis conducted on geographies consisting of 236,329,760 people shows a poor positive correlation between the proportion of Immigrants from Nicaragua and labor force participation rate among population between the ages 35 and 44 in the United States with a correlation coefficient (R) of 0.123 and weighted average of 84.1%, a difference of 0.85%.
In Labor Force | Age 35-44 Correlation Summary
| Measurement | Immigrants from Belarus | Immigrants from Nicaragua |
| Minimum | 69.4% | 60.4% |
| Maximum | 100.0% | 100.0% |
| Range | 30.6% | 39.6% |
| Mean | 85.5% | 85.5% |
| Median | 85.3% | 85.1% |
| Interquartile 25% (IQ1) | 82.9% | 83.4% |
| Interquartile 75% (IQ3) | 87.4% | 88.1% |
| Interquartile Range (IQR) | 4.5% | 4.7% |
| Standard Deviation (Sample) | 6.1% | 6.6% |
| Standard Deviation (Population) | 6.1% | 6.5% |
Similar Demographics by In Labor Force | Age 35-44
Demographics Similar to Immigrants from Belarus by In Labor Force | Age 35-44
In terms of in labor force | age 35-44, the demographic groups most similar to Immigrants from Belarus are Immigrants from Southern Europe (84.8%, a difference of 0.0%), Immigrants from Sweden (84.8%, a difference of 0.0%), Immigrants from Australia (84.8%, a difference of 0.010%), South American (84.8%, a difference of 0.010%), and Immigrants from Bahamas (84.8%, a difference of 0.010%).
| Demographics | Rating | Rank | In Labor Force | Age 35-44 |
| Cubans | 96.6 /100 | #96 | Exceptional 84.8% |
| Egyptians | 96.6 /100 | #97 | Exceptional 84.8% |
| Indians (Asian) | 96.1 /100 | #98 | Exceptional 84.8% |
| Haitians | 96.0 /100 | #99 | Exceptional 84.8% |
| Immigrants | Czechoslovakia | 95.9 /100 | #100 | Exceptional 84.8% |
| Immigrants | Australia | 95.5 /100 | #101 | Exceptional 84.8% |
| Immigrants | Southern Europe | 95.3 /100 | #102 | Exceptional 84.8% |
| Immigrants | Belarus | 95.3 /100 | #103 | Exceptional 84.8% |
| Immigrants | Sweden | 95.2 /100 | #104 | Exceptional 84.8% |
| South Americans | 95.0 /100 | #105 | Exceptional 84.8% |
| Immigrants | Bahamas | 94.8 /100 | #106 | Exceptional 84.8% |
| Immigrants | Romania | 94.7 /100 | #107 | Exceptional 84.8% |
| Immigrants | Argentina | 94.5 /100 | #108 | Exceptional 84.8% |
| Immigrants | Russia | 94.5 /100 | #109 | Exceptional 84.8% |
| Filipinos | 93.8 /100 | #110 | Exceptional 84.7% |
Demographics Similar to Immigrants from Nicaragua by In Labor Force | Age 35-44
In terms of in labor force | age 35-44, the demographic groups most similar to Immigrants from Nicaragua are Subsaharan African (84.1%, a difference of 0.0%), Immigrants from Norway (84.1%, a difference of 0.040%), French (84.0%, a difference of 0.040%), European (84.1%, a difference of 0.050%), and Nicaraguan (84.1%, a difference of 0.050%).
| Demographics | Rating | Rank | In Labor Force | Age 35-44 |
| Immigrants | Ecuador | 15.2 /100 | #211 | Poor 84.1% |
| Israelis | 14.0 /100 | #212 | Poor 84.1% |
| Bangladeshis | 13.7 /100 | #213 | Poor 84.1% |
| Immigrants | Barbados | 13.2 /100 | #214 | Poor 84.1% |
| Europeans | 12.2 /100 | #215 | Poor 84.1% |
| Nicaraguans | 12.1 /100 | #216 | Poor 84.1% |
| Immigrants | Norway | 11.7 /100 | #217 | Poor 84.1% |
| Immigrants | Nicaragua | 9.4 /100 | #218 | Tragic 84.1% |
| Sub-Saharan Africans | 9.3 /100 | #219 | Tragic 84.1% |
| French | 7.5 /100 | #220 | Tragic 84.0% |
| Icelanders | 6.7 /100 | #221 | Tragic 84.0% |
| Assyrians/Chaldeans/Syriacs | 6.6 /100 | #222 | Tragic 84.0% |
| Immigrants | Panama | 6.4 /100 | #223 | Tragic 84.0% |
| U.S. Virgin Islanders | 6.1 /100 | #224 | Tragic 84.0% |
| Immigrants | Burma/Myanmar | 6.1 /100 | #225 | Tragic 84.0% |