Ute vs Dominican In Labor Force | Age 35-44
COMPARE
Ute
Dominican
In Labor Force | Age 35-44
In Labor Force | Age 35-44 Comparison
Ute
Dominicans
79.4%
IN LABOR FORCE | AGE 35-44
0.0/ 100
METRIC RATING
332nd/ 347
METRIC RANK
83.1%
IN LABOR FORCE | AGE 35-44
0.0/ 100
METRIC RATING
280th/ 347
METRIC RANK
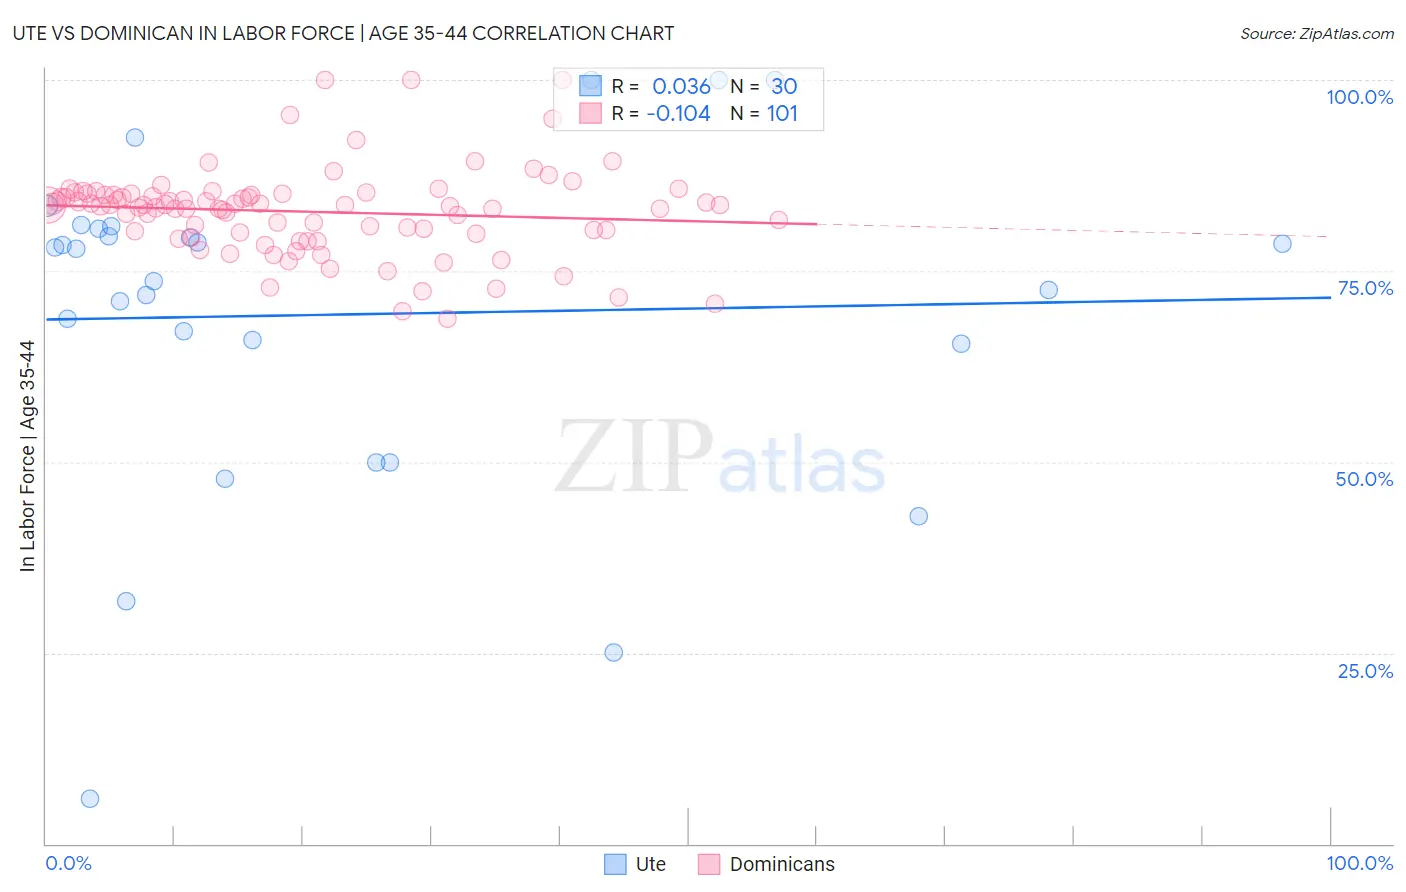
Ute vs Dominican In Labor Force | Age 35-44 Correlation Chart
The statistical analysis conducted on geographies consisting of 55,667,547 people shows no correlation between the proportion of Ute and labor force participation rate among population between the ages 35 and 44 in the United States with a correlation coefficient (R) of 0.036 and weighted average of 79.4%. Similarly, the statistical analysis conducted on geographies consisting of 354,840,200 people shows a poor negative correlation between the proportion of Dominicans and labor force participation rate among population between the ages 35 and 44 in the United States with a correlation coefficient (R) of -0.104 and weighted average of 83.1%, a difference of 4.6%.
In Labor Force | Age 35-44 Correlation Summary
| Measurement | Ute | Dominican |
| Minimum | 5.9% | 68.8% |
| Maximum | 100.0% | 100.0% |
| Range | 94.1% | 31.2% |
| Mean | 69.3% | 82.8% |
| Median | 75.8% | 83.7% |
| Interquartile 25% (IQ1) | 65.5% | 80.0% |
| Interquartile 75% (IQ3) | 80.5% | 85.0% |
| Interquartile Range (IQR) | 15.0% | 5.0% |
| Standard Deviation (Sample) | 21.9% | 5.7% |
| Standard Deviation (Population) | 21.6% | 5.6% |
Similar Demographics by In Labor Force | Age 35-44
Demographics Similar to Ute by In Labor Force | Age 35-44
In terms of in labor force | age 35-44, the demographic groups most similar to Ute are Houma (79.5%, a difference of 0.060%), Cheyenne (79.5%, a difference of 0.080%), Menominee (79.7%, a difference of 0.28%), Kiowa (79.2%, a difference of 0.33%), and Yakama (79.0%, a difference of 0.62%).
| Demographics | Rating | Rank | In Labor Force | Age 35-44 |
| Dutch West Indians | 0.0 /100 | #325 | Tragic 80.4% |
| Seminole | 0.0 /100 | #326 | Tragic 80.4% |
| Sioux | 0.0 /100 | #327 | Tragic 80.2% |
| Creek | 0.0 /100 | #328 | Tragic 80.0% |
| Menominee | 0.0 /100 | #329 | Tragic 79.7% |
| Cheyenne | 0.0 /100 | #330 | Tragic 79.5% |
| Houma | 0.0 /100 | #331 | Tragic 79.5% |
| Ute | 0.0 /100 | #332 | Tragic 79.4% |
| Kiowa | 0.0 /100 | #333 | Tragic 79.2% |
| Yakama | 0.0 /100 | #334 | Tragic 79.0% |
| Natives/Alaskans | 0.0 /100 | #335 | Tragic 78.9% |
| Arapaho | 0.0 /100 | #336 | Tragic 78.1% |
| Apache | 0.0 /100 | #337 | Tragic 77.9% |
| Pueblo | 0.0 /100 | #338 | Tragic 77.4% |
| Yup'ik | 0.0 /100 | #339 | Tragic 77.3% |
Demographics Similar to Dominicans by In Labor Force | Age 35-44
In terms of in labor force | age 35-44, the demographic groups most similar to Dominicans are Immigrants from Micronesia (83.1%, a difference of 0.040%), Belizean (83.1%, a difference of 0.050%), Delaware (83.2%, a difference of 0.13%), Samoan (83.2%, a difference of 0.13%), and Guatemalan (83.0%, a difference of 0.13%).
| Demographics | Rating | Rank | In Labor Force | Age 35-44 |
| Spanish | 0.0 /100 | #273 | Tragic 83.2% |
| Immigrants | Nonimmigrants | 0.0 /100 | #274 | Tragic 83.2% |
| Hawaiians | 0.0 /100 | #275 | Tragic 83.2% |
| Delaware | 0.0 /100 | #276 | Tragic 83.2% |
| Samoans | 0.0 /100 | #277 | Tragic 83.2% |
| Belizeans | 0.0 /100 | #278 | Tragic 83.1% |
| Immigrants | Micronesia | 0.0 /100 | #279 | Tragic 83.1% |
| Dominicans | 0.0 /100 | #280 | Tragic 83.1% |
| Guatemalans | 0.0 /100 | #281 | Tragic 83.0% |
| Osage | 0.0 /100 | #282 | Tragic 82.9% |
| Immigrants | Guatemala | 0.0 /100 | #283 | Tragic 82.9% |
| Immigrants | Dominican Republic | 0.0 /100 | #284 | Tragic 82.9% |
| Fijians | 0.0 /100 | #285 | Tragic 82.9% |
| Immigrants | Bangladesh | 0.0 /100 | #286 | Tragic 82.9% |
| Immigrants | Belize | 0.0 /100 | #287 | Tragic 82.9% |