Ute vs Immigrants from Bosnia and Herzegovina In Labor Force | Age 35-44
COMPARE
Ute
Immigrants from Bosnia and Herzegovina
In Labor Force | Age 35-44
In Labor Force | Age 35-44 Comparison
Ute
Immigrants from Bosnia and Herzegovina
79.4%
IN LABOR FORCE | AGE 35-44
0.0/ 100
METRIC RATING
332nd/ 347
METRIC RANK
85.4%
IN LABOR FORCE | AGE 35-44
100.0/ 100
METRIC RATING
22nd/ 347
METRIC RANK
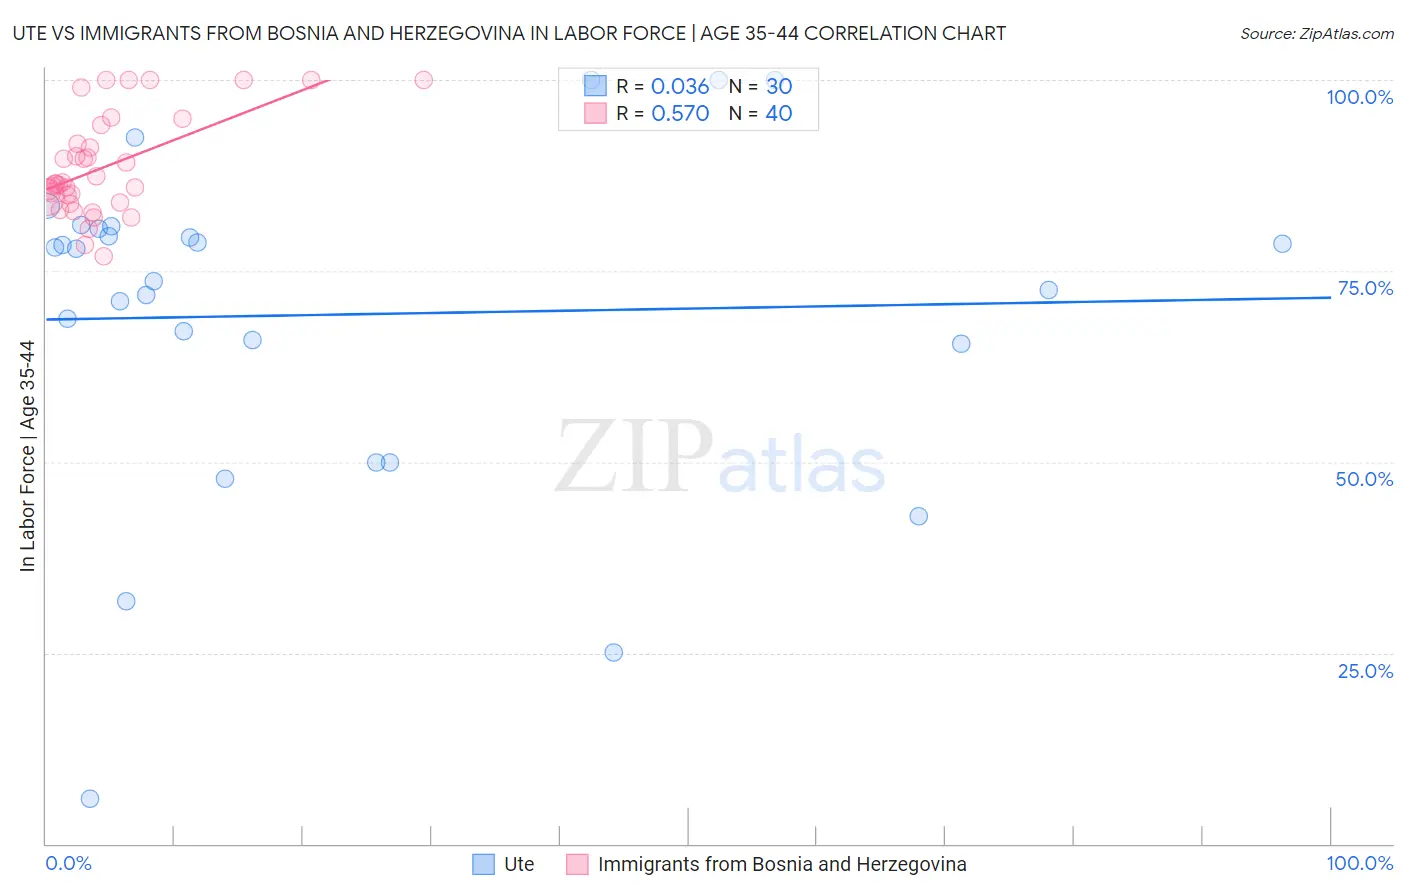
Ute vs Immigrants from Bosnia and Herzegovina In Labor Force | Age 35-44 Correlation Chart
The statistical analysis conducted on geographies consisting of 55,667,547 people shows no correlation between the proportion of Ute and labor force participation rate among population between the ages 35 and 44 in the United States with a correlation coefficient (R) of 0.036 and weighted average of 79.4%. Similarly, the statistical analysis conducted on geographies consisting of 156,807,343 people shows a substantial positive correlation between the proportion of Immigrants from Bosnia and Herzegovina and labor force participation rate among population between the ages 35 and 44 in the United States with a correlation coefficient (R) of 0.570 and weighted average of 85.4%, a difference of 7.5%.
In Labor Force | Age 35-44 Correlation Summary
| Measurement | Ute | Immigrants from Bosnia and Herzegovina |
| Minimum | 5.9% | 76.9% |
| Maximum | 100.0% | 100.0% |
| Range | 94.1% | 23.1% |
| Mean | 69.3% | 88.7% |
| Median | 75.8% | 86.4% |
| Interquartile 25% (IQ1) | 65.5% | 84.3% |
| Interquartile 75% (IQ3) | 80.5% | 92.8% |
| Interquartile Range (IQR) | 15.0% | 8.6% |
| Standard Deviation (Sample) | 21.9% | 6.5% |
| Standard Deviation (Population) | 21.6% | 6.5% |
Similar Demographics by In Labor Force | Age 35-44
Demographics Similar to Ute by In Labor Force | Age 35-44
In terms of in labor force | age 35-44, the demographic groups most similar to Ute are Houma (79.5%, a difference of 0.060%), Cheyenne (79.5%, a difference of 0.080%), Menominee (79.7%, a difference of 0.28%), Kiowa (79.2%, a difference of 0.33%), and Yakama (79.0%, a difference of 0.62%).
| Demographics | Rating | Rank | In Labor Force | Age 35-44 |
| Dutch West Indians | 0.0 /100 | #325 | Tragic 80.4% |
| Seminole | 0.0 /100 | #326 | Tragic 80.4% |
| Sioux | 0.0 /100 | #327 | Tragic 80.2% |
| Creek | 0.0 /100 | #328 | Tragic 80.0% |
| Menominee | 0.0 /100 | #329 | Tragic 79.7% |
| Cheyenne | 0.0 /100 | #330 | Tragic 79.5% |
| Houma | 0.0 /100 | #331 | Tragic 79.5% |
| Ute | 0.0 /100 | #332 | Tragic 79.4% |
| Kiowa | 0.0 /100 | #333 | Tragic 79.2% |
| Yakama | 0.0 /100 | #334 | Tragic 79.0% |
| Natives/Alaskans | 0.0 /100 | #335 | Tragic 78.9% |
| Arapaho | 0.0 /100 | #336 | Tragic 78.1% |
| Apache | 0.0 /100 | #337 | Tragic 77.9% |
| Pueblo | 0.0 /100 | #338 | Tragic 77.4% |
| Yup'ik | 0.0 /100 | #339 | Tragic 77.3% |
Demographics Similar to Immigrants from Bosnia and Herzegovina by In Labor Force | Age 35-44
In terms of in labor force | age 35-44, the demographic groups most similar to Immigrants from Bosnia and Herzegovina are Immigrants from Eastern Africa (85.4%, a difference of 0.020%), Bulgarian (85.5%, a difference of 0.040%), Latvian (85.4%, a difference of 0.080%), Paraguayan (85.4%, a difference of 0.090%), and Immigrants from Liberia (85.4%, a difference of 0.090%).
| Demographics | Rating | Rank | In Labor Force | Age 35-44 |
| Norwegians | 100.0 /100 | #15 | Exceptional 85.6% |
| Immigrants | Ireland | 100.0 /100 | #16 | Exceptional 85.6% |
| Immigrants | North Macedonia | 100.0 /100 | #17 | Exceptional 85.6% |
| Carpatho Rusyns | 100.0 /100 | #18 | Exceptional 85.6% |
| Slovenes | 100.0 /100 | #19 | Exceptional 85.6% |
| Immigrants | Serbia | 100.0 /100 | #20 | Exceptional 85.5% |
| Bulgarians | 100.0 /100 | #21 | Exceptional 85.5% |
| Immigrants | Bosnia and Herzegovina | 100.0 /100 | #22 | Exceptional 85.4% |
| Immigrants | Eastern Africa | 100.0 /100 | #23 | Exceptional 85.4% |
| Latvians | 99.9 /100 | #24 | Exceptional 85.4% |
| Paraguayans | 99.9 /100 | #25 | Exceptional 85.4% |
| Immigrants | Liberia | 99.9 /100 | #26 | Exceptional 85.4% |
| Immigrants | Lithuania | 99.9 /100 | #27 | Exceptional 85.4% |
| Immigrants | Greece | 99.9 /100 | #28 | Exceptional 85.3% |
| Cambodians | 99.9 /100 | #29 | Exceptional 85.3% |