Puget Sound Salish vs Immigrants from Nicaragua In Labor Force | Age 35-44
COMPARE
Puget Sound Salish
Immigrants from Nicaragua
In Labor Force | Age 35-44
In Labor Force | Age 35-44 Comparison
Puget Sound Salish
Immigrants from Nicaragua
82.9%
IN LABOR FORCE | AGE 35-44
0.0/ 100
METRIC RATING
288th/ 347
METRIC RANK
84.1%
IN LABOR FORCE | AGE 35-44
9.4/ 100
METRIC RATING
218th/ 347
METRIC RANK
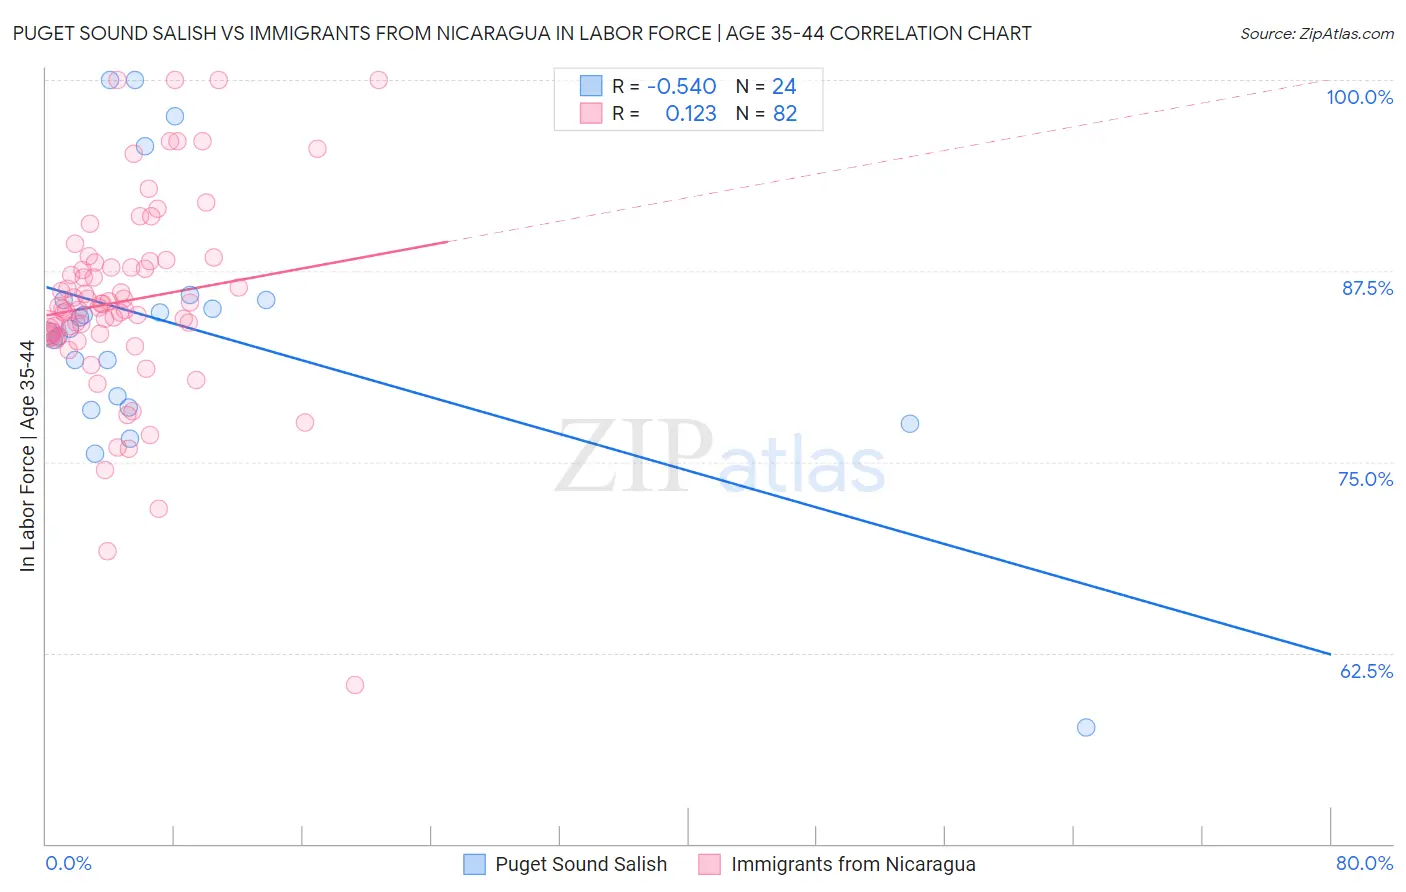
Puget Sound Salish vs Immigrants from Nicaragua In Labor Force | Age 35-44 Correlation Chart
The statistical analysis conducted on geographies consisting of 46,155,509 people shows a substantial negative correlation between the proportion of Puget Sound Salish and labor force participation rate among population between the ages 35 and 44 in the United States with a correlation coefficient (R) of -0.540 and weighted average of 82.9%. Similarly, the statistical analysis conducted on geographies consisting of 236,329,760 people shows a poor positive correlation between the proportion of Immigrants from Nicaragua and labor force participation rate among population between the ages 35 and 44 in the United States with a correlation coefficient (R) of 0.123 and weighted average of 84.1%, a difference of 1.4%.
In Labor Force | Age 35-44 Correlation Summary
| Measurement | Puget Sound Salish | Immigrants from Nicaragua |
| Minimum | 57.6% | 60.4% |
| Maximum | 100.0% | 100.0% |
| Range | 42.4% | 39.6% |
| Mean | 83.7% | 85.5% |
| Median | 83.6% | 85.1% |
| Interquartile 25% (IQ1) | 78.9% | 83.4% |
| Interquartile 75% (IQ3) | 85.6% | 88.1% |
| Interquartile Range (IQR) | 6.6% | 4.7% |
| Standard Deviation (Sample) | 8.9% | 6.6% |
| Standard Deviation (Population) | 8.7% | 6.5% |
Similar Demographics by In Labor Force | Age 35-44
Demographics Similar to Puget Sound Salish by In Labor Force | Age 35-44
In terms of in labor force | age 35-44, the demographic groups most similar to Puget Sound Salish are Chippewa (82.9%, a difference of 0.010%), Fijian (82.9%, a difference of 0.020%), Immigrants from Bangladesh (82.9%, a difference of 0.020%), Immigrants from Belize (82.9%, a difference of 0.020%), and Immigrants from Dominican Republic (82.9%, a difference of 0.030%).
| Demographics | Rating | Rank | In Labor Force | Age 35-44 |
| Guatemalans | 0.0 /100 | #281 | Tragic 83.0% |
| Osage | 0.0 /100 | #282 | Tragic 82.9% |
| Immigrants | Guatemala | 0.0 /100 | #283 | Tragic 82.9% |
| Immigrants | Dominican Republic | 0.0 /100 | #284 | Tragic 82.9% |
| Fijians | 0.0 /100 | #285 | Tragic 82.9% |
| Immigrants | Bangladesh | 0.0 /100 | #286 | Tragic 82.9% |
| Immigrants | Belize | 0.0 /100 | #287 | Tragic 82.9% |
| Puget Sound Salish | 0.0 /100 | #288 | Tragic 82.9% |
| Chippewa | 0.0 /100 | #289 | Tragic 82.9% |
| Africans | 0.0 /100 | #290 | Tragic 82.9% |
| Pennsylvania Germans | 0.0 /100 | #291 | Tragic 82.9% |
| Immigrants | Latin America | 0.0 /100 | #292 | Tragic 82.8% |
| Spanish Americans | 0.0 /100 | #293 | Tragic 82.8% |
| Potawatomi | 0.0 /100 | #294 | Tragic 82.7% |
| Immigrants | Lebanon | 0.0 /100 | #295 | Tragic 82.7% |
Demographics Similar to Immigrants from Nicaragua by In Labor Force | Age 35-44
In terms of in labor force | age 35-44, the demographic groups most similar to Immigrants from Nicaragua are Subsaharan African (84.1%, a difference of 0.0%), Immigrants from Norway (84.1%, a difference of 0.040%), French (84.0%, a difference of 0.040%), European (84.1%, a difference of 0.050%), and Nicaraguan (84.1%, a difference of 0.050%).
| Demographics | Rating | Rank | In Labor Force | Age 35-44 |
| Immigrants | Ecuador | 15.2 /100 | #211 | Poor 84.1% |
| Israelis | 14.0 /100 | #212 | Poor 84.1% |
| Bangladeshis | 13.7 /100 | #213 | Poor 84.1% |
| Immigrants | Barbados | 13.2 /100 | #214 | Poor 84.1% |
| Europeans | 12.2 /100 | #215 | Poor 84.1% |
| Nicaraguans | 12.1 /100 | #216 | Poor 84.1% |
| Immigrants | Norway | 11.7 /100 | #217 | Poor 84.1% |
| Immigrants | Nicaragua | 9.4 /100 | #218 | Tragic 84.1% |
| Sub-Saharan Africans | 9.3 /100 | #219 | Tragic 84.1% |
| French | 7.5 /100 | #220 | Tragic 84.0% |
| Icelanders | 6.7 /100 | #221 | Tragic 84.0% |
| Assyrians/Chaldeans/Syriacs | 6.6 /100 | #222 | Tragic 84.0% |
| Immigrants | Panama | 6.4 /100 | #223 | Tragic 84.0% |
| U.S. Virgin Islanders | 6.1 /100 | #224 | Tragic 84.0% |
| Immigrants | Burma/Myanmar | 6.1 /100 | #225 | Tragic 84.0% |