Ute vs Assyrian/Chaldean/Syriac In Labor Force | Age > 16
COMPARE
Ute
Assyrian/Chaldean/Syriac
In Labor Force | Age > 16
In Labor Force | Age > 16 Comparison
Ute
Assyrians/Chaldeans/Syriacs
60.9%
IN LABOR FORCE | AGE > 16
0.0/ 100
METRIC RATING
331st/ 347
METRIC RANK
64.0%
IN LABOR FORCE | AGE > 16
0.3/ 100
METRIC RATING
278th/ 347
METRIC RANK
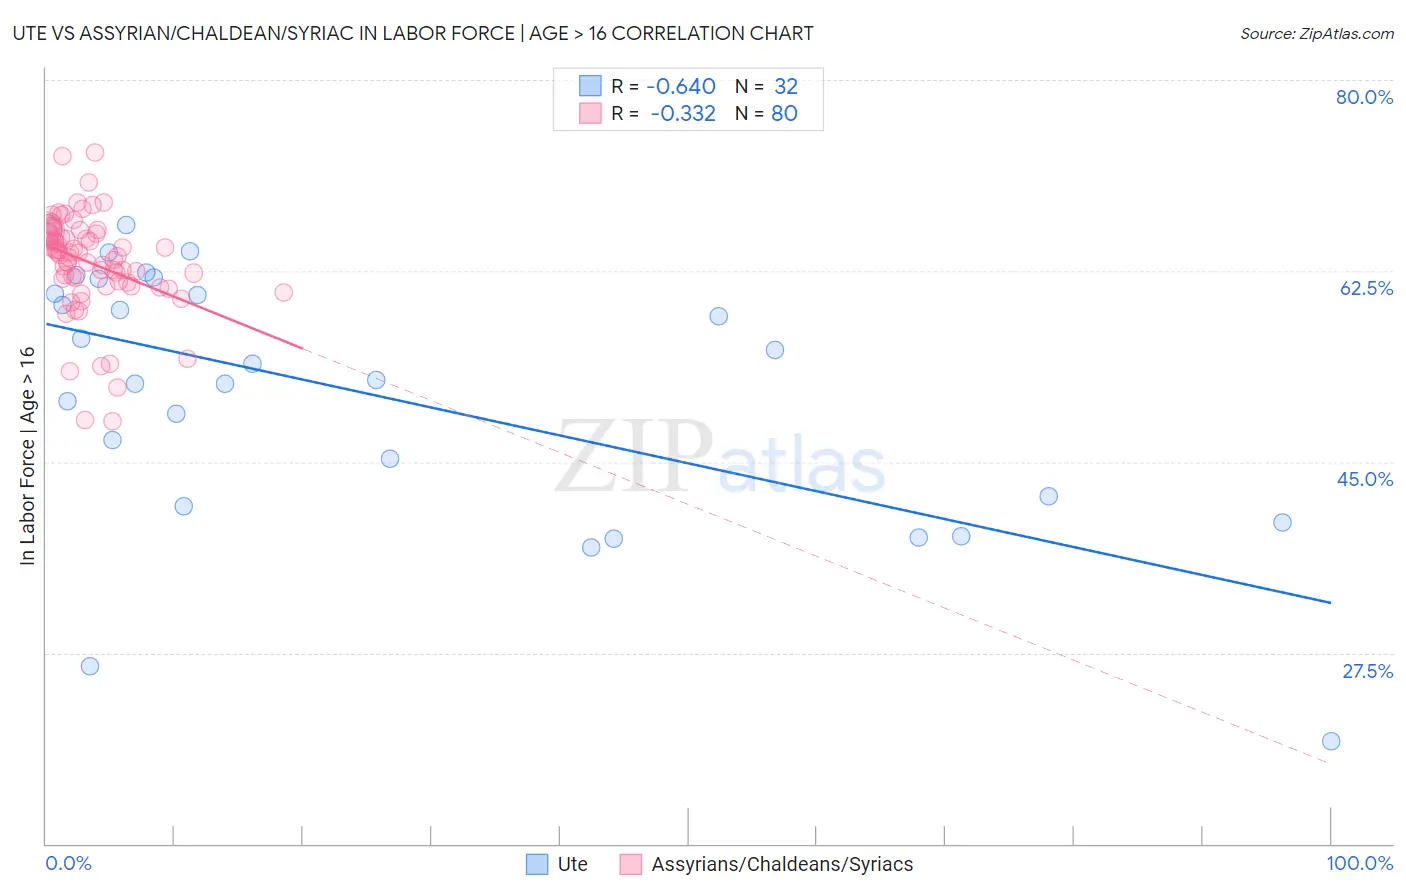
Ute vs Assyrian/Chaldean/Syriac In Labor Force | Age > 16 Correlation Chart
The statistical analysis conducted on geographies consisting of 55,668,599 people shows a significant negative correlation between the proportion of Ute and labor force participation rate among population ages 16 and over in the United States with a correlation coefficient (R) of -0.640 and weighted average of 60.9%. Similarly, the statistical analysis conducted on geographies consisting of 110,318,125 people shows a mild negative correlation between the proportion of Assyrians/Chaldeans/Syriacs and labor force participation rate among population ages 16 and over in the United States with a correlation coefficient (R) of -0.332 and weighted average of 64.0%, a difference of 5.2%.
In Labor Force | Age > 16 Correlation Summary
| Measurement | Ute | Assyrian/Chaldean/Syriac |
| Minimum | 19.4% | 48.7% |
| Maximum | 66.7% | 73.3% |
| Range | 47.3% | 24.6% |
| Mean | 51.3% | 63.3% |
| Median | 53.2% | 64.1% |
| Interquartile 25% (IQ1) | 41.4% | 61.5% |
| Interquartile 75% (IQ3) | 61.1% | 66.0% |
| Interquartile Range (IQR) | 19.6% | 4.5% |
| Standard Deviation (Sample) | 11.9% | 4.6% |
| Standard Deviation (Population) | 11.7% | 4.6% |
Similar Demographics by In Labor Force | Age > 16
Demographics Similar to Ute by In Labor Force | Age > 16
In terms of in labor force | age > 16, the demographic groups most similar to Ute are Crow (60.8%, a difference of 0.17%), Paiute (60.7%, a difference of 0.26%), Apache (60.7%, a difference of 0.30%), Native/Alaskan (60.6%, a difference of 0.49%), and Menominee (60.6%, a difference of 0.51%).
| Demographics | Rating | Rank | In Labor Force | Age > 16 |
| Cheyenne | 0.0 /100 | #324 | Tragic 62.0% |
| Cherokee | 0.0 /100 | #325 | Tragic 61.9% |
| Sioux | 0.0 /100 | #326 | Tragic 61.8% |
| Cajuns | 0.0 /100 | #327 | Tragic 61.8% |
| Dutch West Indians | 0.0 /100 | #328 | Tragic 61.7% |
| Choctaw | 0.0 /100 | #329 | Tragic 61.5% |
| Creek | 0.0 /100 | #330 | Tragic 61.3% |
| Ute | 0.0 /100 | #331 | Tragic 60.9% |
| Crow | 0.0 /100 | #332 | Tragic 60.8% |
| Paiute | 0.0 /100 | #333 | Tragic 60.7% |
| Apache | 0.0 /100 | #334 | Tragic 60.7% |
| Natives/Alaskans | 0.0 /100 | #335 | Tragic 60.6% |
| Menominee | 0.0 /100 | #336 | Tragic 60.6% |
| Colville | 0.0 /100 | #337 | Tragic 59.8% |
| Immigrants | Yemen | 0.0 /100 | #338 | Tragic 59.6% |
Demographics Similar to Assyrians/Chaldeans/Syriacs by In Labor Force | Age > 16
In terms of in labor force | age > 16, the demographic groups most similar to Assyrians/Chaldeans/Syriacs are Immigrants from Bahamas (64.0%, a difference of 0.020%), Welsh (64.0%, a difference of 0.030%), Immigrants from St. Vincent and the Grenadines (64.0%, a difference of 0.040%), French Canadian (64.0%, a difference of 0.040%), and Mexican (64.1%, a difference of 0.050%).
| Demographics | Rating | Rank | In Labor Force | Age > 16 |
| Dominicans | 0.4 /100 | #271 | Tragic 64.1% |
| Native Hawaiians | 0.3 /100 | #272 | Tragic 64.1% |
| Hmong | 0.3 /100 | #273 | Tragic 64.1% |
| Immigrants | Cuba | 0.3 /100 | #274 | Tragic 64.1% |
| Mexicans | 0.3 /100 | #275 | Tragic 64.1% |
| French American Indians | 0.3 /100 | #276 | Tragic 64.1% |
| Immigrants | Bahamas | 0.3 /100 | #277 | Tragic 64.0% |
| Assyrians/Chaldeans/Syriacs | 0.3 /100 | #278 | Tragic 64.0% |
| Welsh | 0.2 /100 | #279 | Tragic 64.0% |
| Immigrants | St. Vincent and the Grenadines | 0.2 /100 | #280 | Tragic 64.0% |
| French Canadians | 0.2 /100 | #281 | Tragic 64.0% |
| Immigrants | Guyana | 0.2 /100 | #282 | Tragic 64.0% |
| Immigrants | Germany | 0.1 /100 | #283 | Tragic 63.9% |
| French | 0.1 /100 | #284 | Tragic 63.9% |
| Slovaks | 0.1 /100 | #285 | Tragic 63.9% |