Ute vs Croatian In Labor Force | Age > 16
COMPARE
Ute
Croatian
In Labor Force | Age > 16
In Labor Force | Age > 16 Comparison
Ute
Croatians
60.9%
IN LABOR FORCE | AGE > 16
0.0/ 100
METRIC RATING
331st/ 347
METRIC RANK
64.7%
IN LABOR FORCE | AGE > 16
8.8/ 100
METRIC RATING
225th/ 347
METRIC RANK
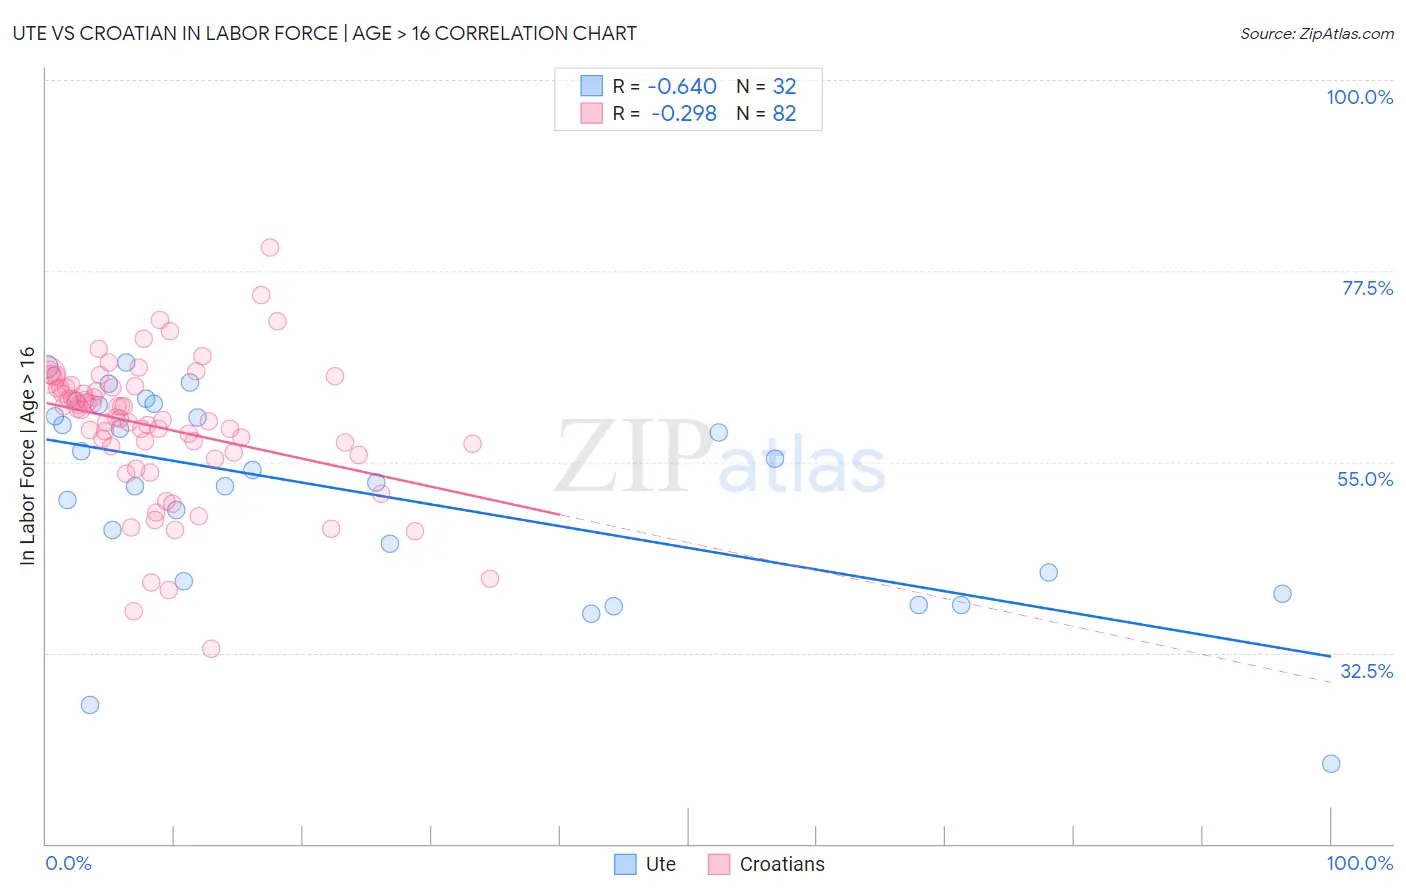
Ute vs Croatian In Labor Force | Age > 16 Correlation Chart
The statistical analysis conducted on geographies consisting of 55,668,599 people shows a significant negative correlation between the proportion of Ute and labor force participation rate among population ages 16 and over in the United States with a correlation coefficient (R) of -0.640 and weighted average of 60.9%. Similarly, the statistical analysis conducted on geographies consisting of 375,747,004 people shows a weak negative correlation between the proportion of Croatians and labor force participation rate among population ages 16 and over in the United States with a correlation coefficient (R) of -0.298 and weighted average of 64.7%, a difference of 6.3%.
In Labor Force | Age > 16 Correlation Summary
| Measurement | Ute | Croatian |
| Minimum | 19.4% | 33.0% |
| Maximum | 66.7% | 80.2% |
| Range | 47.3% | 47.2% |
| Mean | 51.3% | 59.1% |
| Median | 53.2% | 60.6% |
| Interquartile 25% (IQ1) | 41.4% | 56.1% |
| Interquartile 75% (IQ3) | 61.1% | 63.8% |
| Interquartile Range (IQR) | 19.6% | 7.7% |
| Standard Deviation (Sample) | 11.9% | 8.3% |
| Standard Deviation (Population) | 11.7% | 8.2% |
Similar Demographics by In Labor Force | Age > 16
Demographics Similar to Ute by In Labor Force | Age > 16
In terms of in labor force | age > 16, the demographic groups most similar to Ute are Crow (60.8%, a difference of 0.17%), Paiute (60.7%, a difference of 0.26%), Apache (60.7%, a difference of 0.30%), Native/Alaskan (60.6%, a difference of 0.49%), and Menominee (60.6%, a difference of 0.51%).
| Demographics | Rating | Rank | In Labor Force | Age > 16 |
| Cheyenne | 0.0 /100 | #324 | Tragic 62.0% |
| Cherokee | 0.0 /100 | #325 | Tragic 61.9% |
| Sioux | 0.0 /100 | #326 | Tragic 61.8% |
| Cajuns | 0.0 /100 | #327 | Tragic 61.8% |
| Dutch West Indians | 0.0 /100 | #328 | Tragic 61.7% |
| Choctaw | 0.0 /100 | #329 | Tragic 61.5% |
| Creek | 0.0 /100 | #330 | Tragic 61.3% |
| Ute | 0.0 /100 | #331 | Tragic 60.9% |
| Crow | 0.0 /100 | #332 | Tragic 60.8% |
| Paiute | 0.0 /100 | #333 | Tragic 60.7% |
| Apache | 0.0 /100 | #334 | Tragic 60.7% |
| Natives/Alaskans | 0.0 /100 | #335 | Tragic 60.6% |
| Menominee | 0.0 /100 | #336 | Tragic 60.6% |
| Colville | 0.0 /100 | #337 | Tragic 59.8% |
| Immigrants | Yemen | 0.0 /100 | #338 | Tragic 59.6% |
Demographics Similar to Croatians by In Labor Force | Age > 16
In terms of in labor force | age > 16, the demographic groups most similar to Croatians are Immigrants from Jamaica (64.7%, a difference of 0.0%), Immigrants from Belize (64.7%, a difference of 0.010%), Hawaiian (64.7%, a difference of 0.020%), European (64.7%, a difference of 0.020%), and Polish (64.7%, a difference of 0.020%).
| Demographics | Rating | Rank | In Labor Force | Age > 16 |
| Alsatians | 10.7 /100 | #218 | Poor 64.7% |
| Immigrants | Central America | 10.5 /100 | #219 | Poor 64.7% |
| Alaska Natives | 9.9 /100 | #220 | Tragic 64.7% |
| Immigrants | Micronesia | 9.6 /100 | #221 | Tragic 64.7% |
| Hawaiians | 9.3 /100 | #222 | Tragic 64.7% |
| Immigrants | Belize | 9.2 /100 | #223 | Tragic 64.7% |
| Immigrants | Jamaica | 8.8 /100 | #224 | Tragic 64.7% |
| Croatians | 8.8 /100 | #225 | Tragic 64.7% |
| Europeans | 8.3 /100 | #226 | Tragic 64.7% |
| Poles | 8.3 /100 | #227 | Tragic 64.7% |
| Northern Europeans | 8.2 /100 | #228 | Tragic 64.7% |
| British | 7.3 /100 | #229 | Tragic 64.7% |
| Chinese | 7.3 /100 | #230 | Tragic 64.7% |
| Immigrants | Northern Europe | 7.2 /100 | #231 | Tragic 64.7% |
| Africans | 5.8 /100 | #232 | Tragic 64.6% |