Ute vs Immigrants from Fiji In Labor Force | Age > 16
COMPARE
Ute
Immigrants from Fiji
In Labor Force | Age > 16
In Labor Force | Age > 16 Comparison
Ute
Immigrants from Fiji
60.9%
IN LABOR FORCE | AGE > 16
0.0/ 100
METRIC RATING
331st/ 347
METRIC RANK
65.0%
IN LABOR FORCE | AGE > 16
33.7/ 100
METRIC RATING
192nd/ 347
METRIC RANK
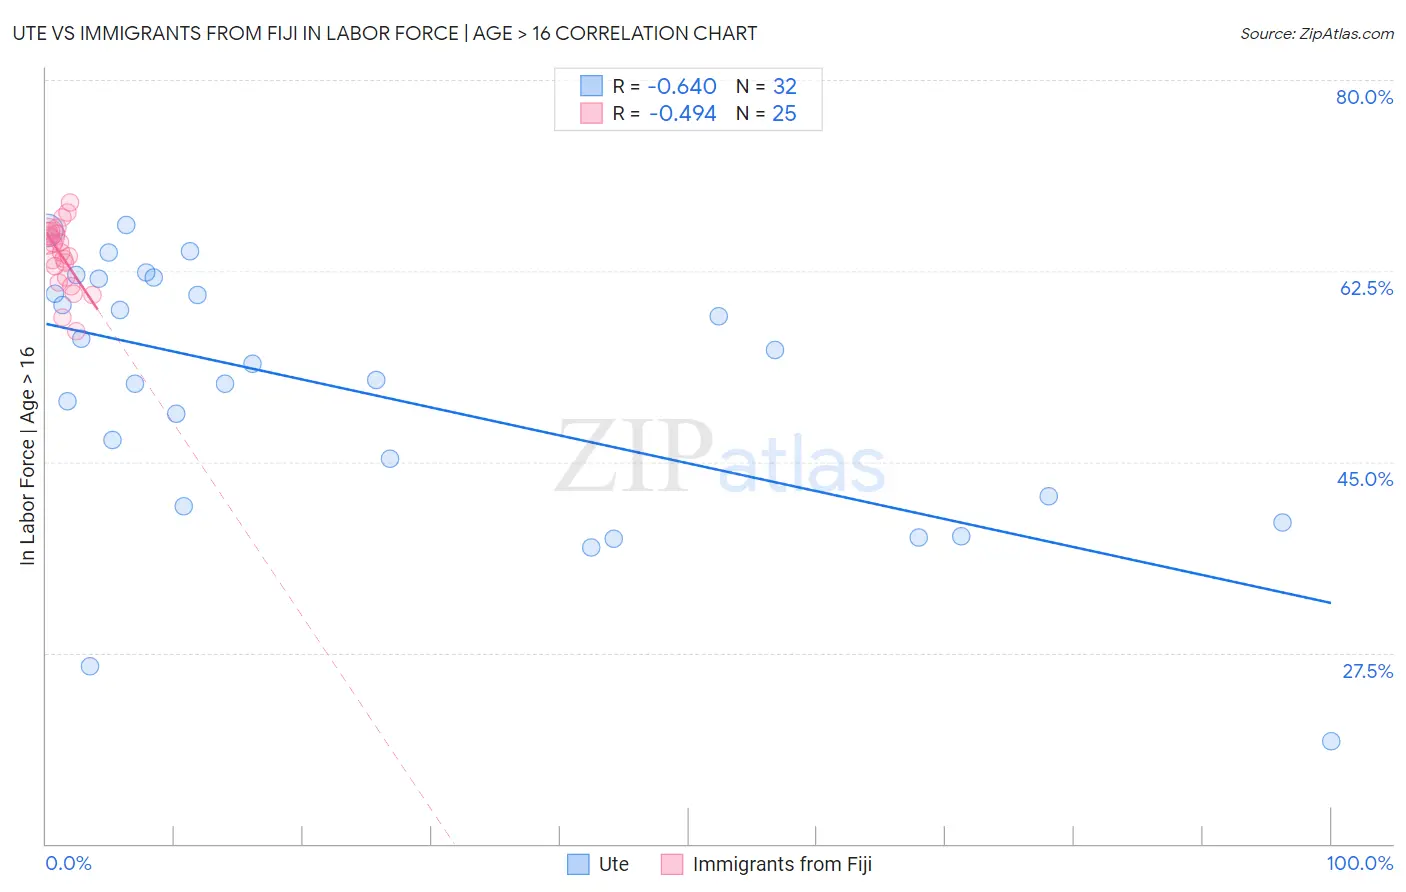
Ute vs Immigrants from Fiji In Labor Force | Age > 16 Correlation Chart
The statistical analysis conducted on geographies consisting of 55,668,599 people shows a significant negative correlation between the proportion of Ute and labor force participation rate among population ages 16 and over in the United States with a correlation coefficient (R) of -0.640 and weighted average of 60.9%. Similarly, the statistical analysis conducted on geographies consisting of 93,756,016 people shows a moderate negative correlation between the proportion of Immigrants from Fiji and labor force participation rate among population ages 16 and over in the United States with a correlation coefficient (R) of -0.494 and weighted average of 65.0%, a difference of 6.8%.
In Labor Force | Age > 16 Correlation Summary
| Measurement | Ute | Immigrants from Fiji |
| Minimum | 19.4% | 57.0% |
| Maximum | 66.7% | 68.8% |
| Range | 47.3% | 11.8% |
| Mean | 51.3% | 63.9% |
| Median | 53.2% | 64.2% |
| Interquartile 25% (IQ1) | 41.4% | 61.7% |
| Interquartile 75% (IQ3) | 61.1% | 66.0% |
| Interquartile Range (IQR) | 19.6% | 4.3% |
| Standard Deviation (Sample) | 11.9% | 3.0% |
| Standard Deviation (Population) | 11.7% | 2.9% |
Similar Demographics by In Labor Force | Age > 16
Demographics Similar to Ute by In Labor Force | Age > 16
In terms of in labor force | age > 16, the demographic groups most similar to Ute are Crow (60.8%, a difference of 0.17%), Paiute (60.7%, a difference of 0.26%), Apache (60.7%, a difference of 0.30%), Native/Alaskan (60.6%, a difference of 0.49%), and Menominee (60.6%, a difference of 0.51%).
| Demographics | Rating | Rank | In Labor Force | Age > 16 |
| Cheyenne | 0.0 /100 | #324 | Tragic 62.0% |
| Cherokee | 0.0 /100 | #325 | Tragic 61.9% |
| Sioux | 0.0 /100 | #326 | Tragic 61.8% |
| Cajuns | 0.0 /100 | #327 | Tragic 61.8% |
| Dutch West Indians | 0.0 /100 | #328 | Tragic 61.7% |
| Choctaw | 0.0 /100 | #329 | Tragic 61.5% |
| Creek | 0.0 /100 | #330 | Tragic 61.3% |
| Ute | 0.0 /100 | #331 | Tragic 60.9% |
| Crow | 0.0 /100 | #332 | Tragic 60.8% |
| Paiute | 0.0 /100 | #333 | Tragic 60.7% |
| Apache | 0.0 /100 | #334 | Tragic 60.7% |
| Natives/Alaskans | 0.0 /100 | #335 | Tragic 60.6% |
| Menominee | 0.0 /100 | #336 | Tragic 60.6% |
| Colville | 0.0 /100 | #337 | Tragic 59.8% |
| Immigrants | Yemen | 0.0 /100 | #338 | Tragic 59.6% |
Demographics Similar to Immigrants from Fiji by In Labor Force | Age > 16
In terms of in labor force | age > 16, the demographic groups most similar to Immigrants from Fiji are Barbadian (65.0%, a difference of 0.0%), Scandinavian (65.0%, a difference of 0.0%), Immigrants from Europe (65.0%, a difference of 0.0%), Immigrants from Portugal (65.0%, a difference of 0.010%), and Immigrants from Greece (65.0%, a difference of 0.010%).
| Demographics | Rating | Rank | In Labor Force | Age > 16 |
| Syrians | 40.0 /100 | #185 | Average 65.0% |
| Immigrants | Switzerland | 38.2 /100 | #186 | Fair 65.0% |
| Immigrants | Croatia | 35.7 /100 | #187 | Fair 65.0% |
| Immigrants | Portugal | 34.8 /100 | #188 | Fair 65.0% |
| Immigrants | Greece | 34.3 /100 | #189 | Fair 65.0% |
| Barbadians | 33.9 /100 | #190 | Fair 65.0% |
| Scandinavians | 33.7 /100 | #191 | Fair 65.0% |
| Immigrants | Fiji | 33.7 /100 | #192 | Fair 65.0% |
| Immigrants | Europe | 33.6 /100 | #193 | Fair 65.0% |
| Immigrants | Southern Europe | 31.3 /100 | #194 | Fair 65.0% |
| Romanians | 31.1 /100 | #195 | Fair 65.0% |
| Haitians | 30.6 /100 | #196 | Fair 65.0% |
| Immigrants | Italy | 28.7 /100 | #197 | Fair 65.0% |
| Greeks | 26.1 /100 | #198 | Fair 64.9% |
| Mexican American Indians | 23.1 /100 | #199 | Fair 64.9% |