Lumbee vs Assyrian/Chaldean/Syriac In Labor Force | Age > 16
COMPARE
Lumbee
Assyrian/Chaldean/Syriac
In Labor Force | Age > 16
In Labor Force | Age > 16 Comparison
Lumbee
Assyrians/Chaldeans/Syriacs
56.8%
IN LABOR FORCE | AGE > 16
0.0/ 100
METRIC RATING
346th/ 347
METRIC RANK
64.0%
IN LABOR FORCE | AGE > 16
0.3/ 100
METRIC RATING
278th/ 347
METRIC RANK
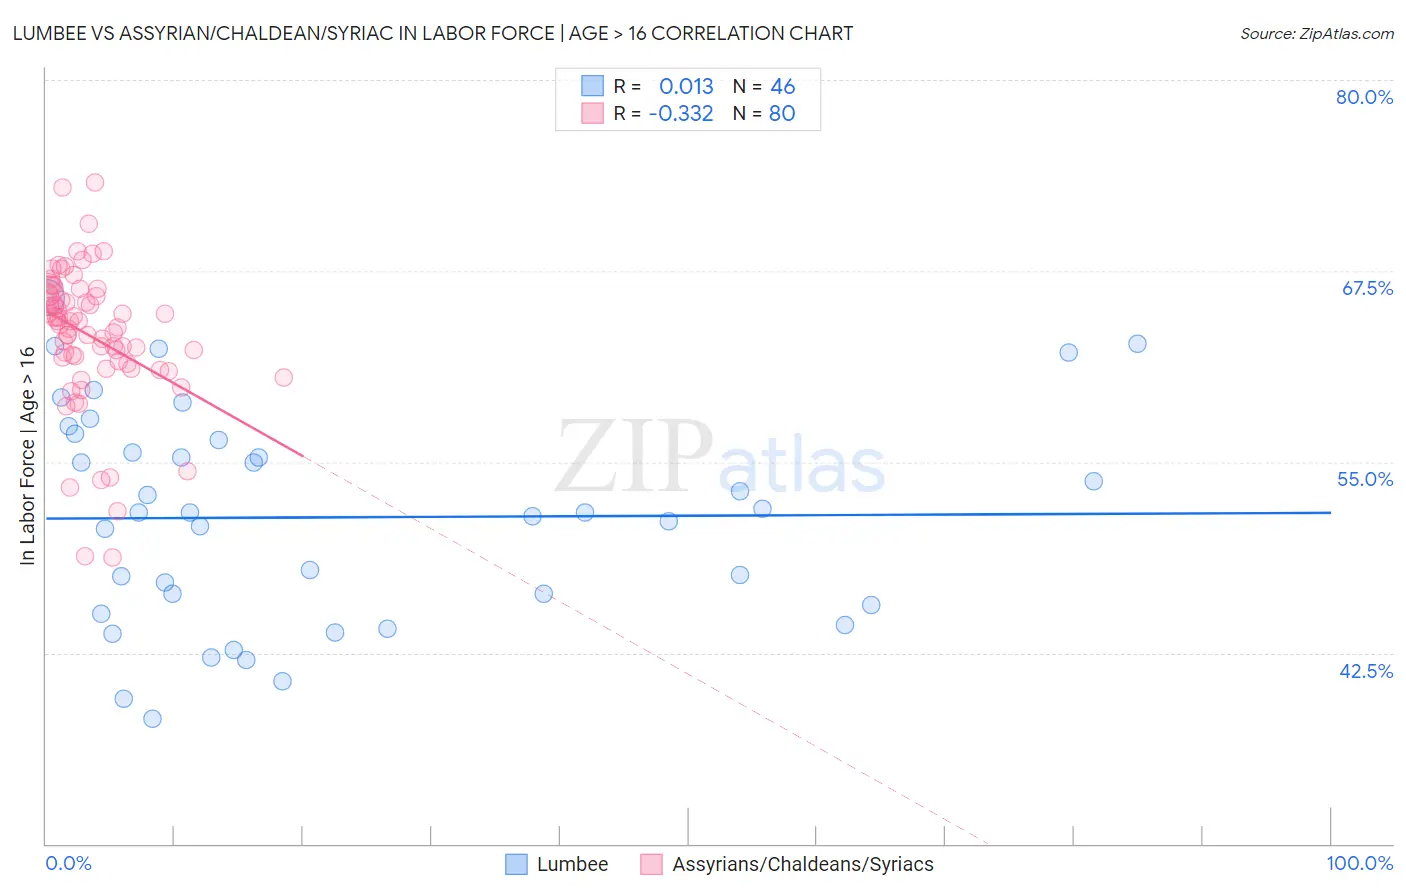
Lumbee vs Assyrian/Chaldean/Syriac In Labor Force | Age > 16 Correlation Chart
The statistical analysis conducted on geographies consisting of 92,293,168 people shows no correlation between the proportion of Lumbee and labor force participation rate among population ages 16 and over in the United States with a correlation coefficient (R) of 0.013 and weighted average of 56.8%. Similarly, the statistical analysis conducted on geographies consisting of 110,318,125 people shows a mild negative correlation between the proportion of Assyrians/Chaldeans/Syriacs and labor force participation rate among population ages 16 and over in the United States with a correlation coefficient (R) of -0.332 and weighted average of 64.0%, a difference of 12.8%.
In Labor Force | Age > 16 Correlation Summary
| Measurement | Lumbee | Assyrian/Chaldean/Syriac |
| Minimum | 38.2% | 48.7% |
| Maximum | 65.7% | 73.3% |
| Range | 27.5% | 24.6% |
| Mean | 51.4% | 63.3% |
| Median | 51.7% | 64.1% |
| Interquartile 25% (IQ1) | 45.6% | 61.5% |
| Interquartile 75% (IQ3) | 56.4% | 66.0% |
| Interquartile Range (IQR) | 10.8% | 4.5% |
| Standard Deviation (Sample) | 7.0% | 4.6% |
| Standard Deviation (Population) | 6.9% | 4.6% |
Similar Demographics by In Labor Force | Age > 16
Demographics Similar to Lumbee by In Labor Force | Age > 16
In terms of in labor force | age > 16, the demographic groups most similar to Lumbee are Navajo (56.6%, a difference of 0.31%), Tohono O'odham (57.2%, a difference of 0.85%), Pima (57.4%, a difference of 1.1%), Yuman (57.8%, a difference of 1.8%), and Puerto Rican (58.1%, a difference of 2.4%).
| Demographics | Rating | Rank | In Labor Force | Age > 16 |
| Paiute | 0.0 /100 | #333 | Tragic 60.7% |
| Apache | 0.0 /100 | #334 | Tragic 60.7% |
| Natives/Alaskans | 0.0 /100 | #335 | Tragic 60.6% |
| Menominee | 0.0 /100 | #336 | Tragic 60.6% |
| Colville | 0.0 /100 | #337 | Tragic 59.8% |
| Immigrants | Yemen | 0.0 /100 | #338 | Tragic 59.6% |
| Houma | 0.0 /100 | #339 | Tragic 59.5% |
| Pueblo | 0.0 /100 | #340 | Tragic 59.3% |
| Hopi | 0.0 /100 | #341 | Tragic 58.4% |
| Puerto Ricans | 0.0 /100 | #342 | Tragic 58.1% |
| Yuman | 0.0 /100 | #343 | Tragic 57.8% |
| Pima | 0.0 /100 | #344 | Tragic 57.4% |
| Tohono O'odham | 0.0 /100 | #345 | Tragic 57.2% |
| Lumbee | 0.0 /100 | #346 | Tragic 56.8% |
| Navajo | 0.0 /100 | #347 | Tragic 56.6% |
Demographics Similar to Assyrians/Chaldeans/Syriacs by In Labor Force | Age > 16
In terms of in labor force | age > 16, the demographic groups most similar to Assyrians/Chaldeans/Syriacs are Immigrants from Bahamas (64.0%, a difference of 0.020%), Welsh (64.0%, a difference of 0.030%), Immigrants from St. Vincent and the Grenadines (64.0%, a difference of 0.040%), French Canadian (64.0%, a difference of 0.040%), and Mexican (64.1%, a difference of 0.050%).
| Demographics | Rating | Rank | In Labor Force | Age > 16 |
| Dominicans | 0.4 /100 | #271 | Tragic 64.1% |
| Native Hawaiians | 0.3 /100 | #272 | Tragic 64.1% |
| Hmong | 0.3 /100 | #273 | Tragic 64.1% |
| Immigrants | Cuba | 0.3 /100 | #274 | Tragic 64.1% |
| Mexicans | 0.3 /100 | #275 | Tragic 64.1% |
| French American Indians | 0.3 /100 | #276 | Tragic 64.1% |
| Immigrants | Bahamas | 0.3 /100 | #277 | Tragic 64.0% |
| Assyrians/Chaldeans/Syriacs | 0.3 /100 | #278 | Tragic 64.0% |
| Welsh | 0.2 /100 | #279 | Tragic 64.0% |
| Immigrants | St. Vincent and the Grenadines | 0.2 /100 | #280 | Tragic 64.0% |
| French Canadians | 0.2 /100 | #281 | Tragic 64.0% |
| Immigrants | Guyana | 0.2 /100 | #282 | Tragic 64.0% |
| Immigrants | Germany | 0.1 /100 | #283 | Tragic 63.9% |
| French | 0.1 /100 | #284 | Tragic 63.9% |
| Slovaks | 0.1 /100 | #285 | Tragic 63.9% |