Ute vs Tongan In Labor Force | Age > 16
COMPARE
Ute
Tongan
In Labor Force | Age > 16
In Labor Force | Age > 16 Comparison
Ute
Tongans
60.9%
IN LABOR FORCE | AGE > 16
0.0/ 100
METRIC RATING
331st/ 347
METRIC RANK
67.5%
IN LABOR FORCE | AGE > 16
100.0/ 100
METRIC RATING
21st/ 347
METRIC RANK
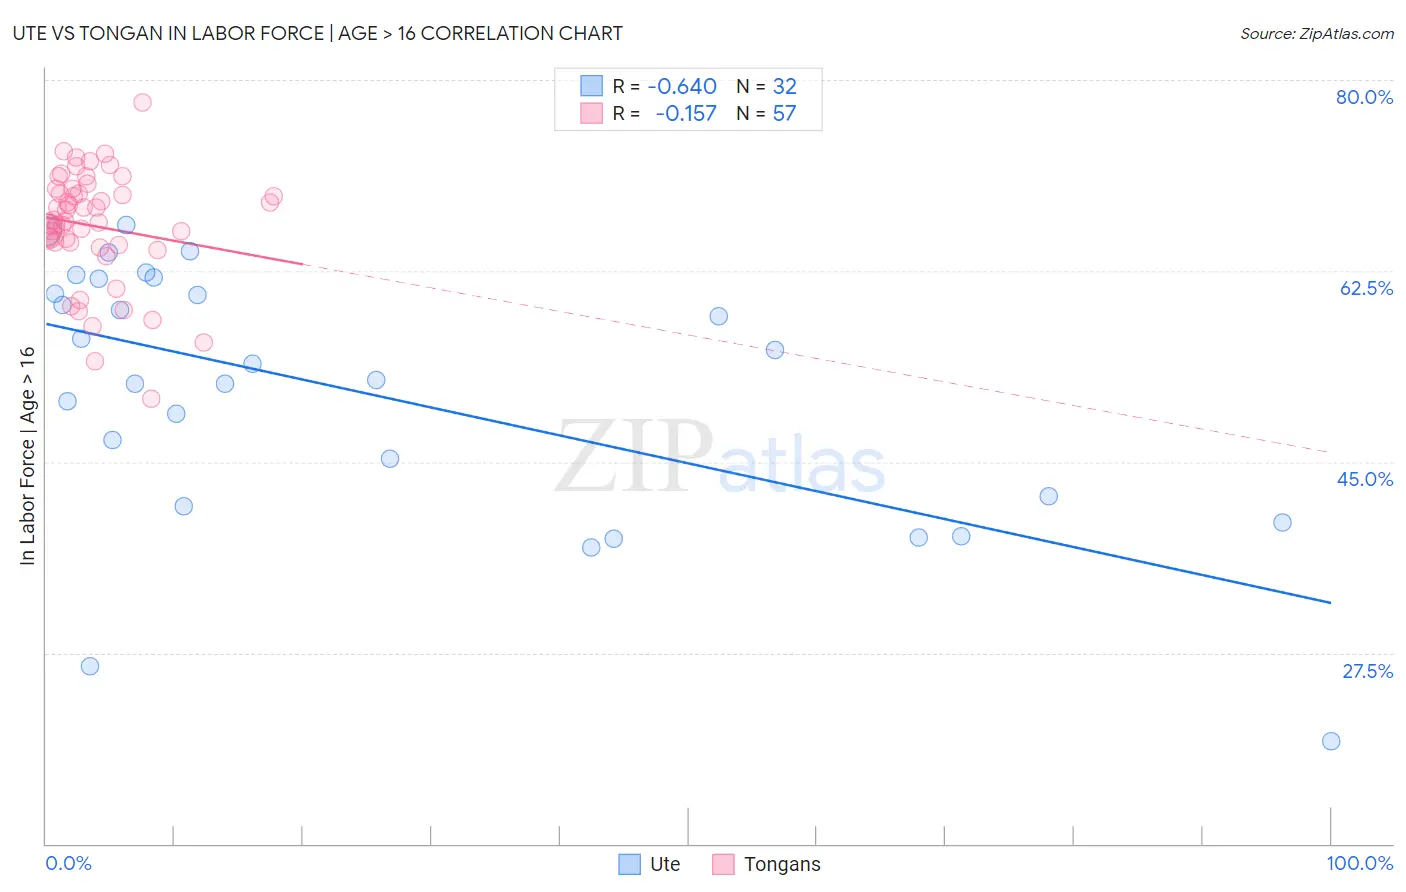
Ute vs Tongan In Labor Force | Age > 16 Correlation Chart
The statistical analysis conducted on geographies consisting of 55,668,599 people shows a significant negative correlation between the proportion of Ute and labor force participation rate among population ages 16 and over in the United States with a correlation coefficient (R) of -0.640 and weighted average of 60.9%. Similarly, the statistical analysis conducted on geographies consisting of 102,905,644 people shows a poor negative correlation between the proportion of Tongans and labor force participation rate among population ages 16 and over in the United States with a correlation coefficient (R) of -0.157 and weighted average of 67.5%, a difference of 10.9%.
In Labor Force | Age > 16 Correlation Summary
| Measurement | Ute | Tongan |
| Minimum | 19.4% | 50.8% |
| Maximum | 66.7% | 77.9% |
| Range | 47.3% | 27.1% |
| Mean | 51.3% | 66.6% |
| Median | 53.2% | 67.1% |
| Interquartile 25% (IQ1) | 41.4% | 65.0% |
| Interquartile 75% (IQ3) | 61.1% | 69.8% |
| Interquartile Range (IQR) | 19.6% | 4.8% |
| Standard Deviation (Sample) | 11.9% | 5.2% |
| Standard Deviation (Population) | 11.7% | 5.1% |
Similar Demographics by In Labor Force | Age > 16
Demographics Similar to Ute by In Labor Force | Age > 16
In terms of in labor force | age > 16, the demographic groups most similar to Ute are Crow (60.8%, a difference of 0.17%), Paiute (60.7%, a difference of 0.26%), Apache (60.7%, a difference of 0.30%), Native/Alaskan (60.6%, a difference of 0.49%), and Menominee (60.6%, a difference of 0.51%).
| Demographics | Rating | Rank | In Labor Force | Age > 16 |
| Cheyenne | 0.0 /100 | #324 | Tragic 62.0% |
| Cherokee | 0.0 /100 | #325 | Tragic 61.9% |
| Sioux | 0.0 /100 | #326 | Tragic 61.8% |
| Cajuns | 0.0 /100 | #327 | Tragic 61.8% |
| Dutch West Indians | 0.0 /100 | #328 | Tragic 61.7% |
| Choctaw | 0.0 /100 | #329 | Tragic 61.5% |
| Creek | 0.0 /100 | #330 | Tragic 61.3% |
| Ute | 0.0 /100 | #331 | Tragic 60.9% |
| Crow | 0.0 /100 | #332 | Tragic 60.8% |
| Paiute | 0.0 /100 | #333 | Tragic 60.7% |
| Apache | 0.0 /100 | #334 | Tragic 60.7% |
| Natives/Alaskans | 0.0 /100 | #335 | Tragic 60.6% |
| Menominee | 0.0 /100 | #336 | Tragic 60.6% |
| Colville | 0.0 /100 | #337 | Tragic 59.8% |
| Immigrants | Yemen | 0.0 /100 | #338 | Tragic 59.6% |
Demographics Similar to Tongans by In Labor Force | Age > 16
In terms of in labor force | age > 16, the demographic groups most similar to Tongans are Immigrants from Kenya (67.6%, a difference of 0.020%), Immigrants from Uganda (67.5%, a difference of 0.060%), Kenyan (67.6%, a difference of 0.070%), Immigrants from Liberia (67.6%, a difference of 0.10%), and Immigrants from India (67.6%, a difference of 0.12%).
| Demographics | Rating | Rank | In Labor Force | Age > 16 |
| Liberians | 100.0 /100 | #14 | Exceptional 67.8% |
| Immigrants | Middle Africa | 100.0 /100 | #15 | Exceptional 67.7% |
| Immigrants | Sudan | 100.0 /100 | #16 | Exceptional 67.7% |
| Immigrants | India | 100.0 /100 | #17 | Exceptional 67.6% |
| Immigrants | Liberia | 100.0 /100 | #18 | Exceptional 67.6% |
| Kenyans | 100.0 /100 | #19 | Exceptional 67.6% |
| Immigrants | Kenya | 100.0 /100 | #20 | Exceptional 67.6% |
| Tongans | 100.0 /100 | #21 | Exceptional 67.5% |
| Immigrants | Uganda | 100.0 /100 | #22 | Exceptional 67.5% |
| Cambodians | 100.0 /100 | #23 | Exceptional 67.4% |
| Ugandans | 100.0 /100 | #24 | Exceptional 67.4% |
| Immigrants | Africa | 100.0 /100 | #25 | Exceptional 67.4% |
| Immigrants | Cabo Verde | 100.0 /100 | #26 | Exceptional 67.3% |
| Zimbabweans | 100.0 /100 | #27 | Exceptional 67.3% |
| Immigrants | Morocco | 100.0 /100 | #28 | Exceptional 67.2% |