Cambodian vs Assyrian/Chaldean/Syriac In Labor Force | Age > 16
COMPARE
Cambodian
Assyrian/Chaldean/Syriac
In Labor Force | Age > 16
In Labor Force | Age > 16 Comparison
Cambodians
Assyrians/Chaldeans/Syriacs
67.4%
IN LABOR FORCE | AGE > 16
100.0/ 100
METRIC RATING
23rd/ 347
METRIC RANK
64.0%
IN LABOR FORCE | AGE > 16
0.3/ 100
METRIC RATING
278th/ 347
METRIC RANK
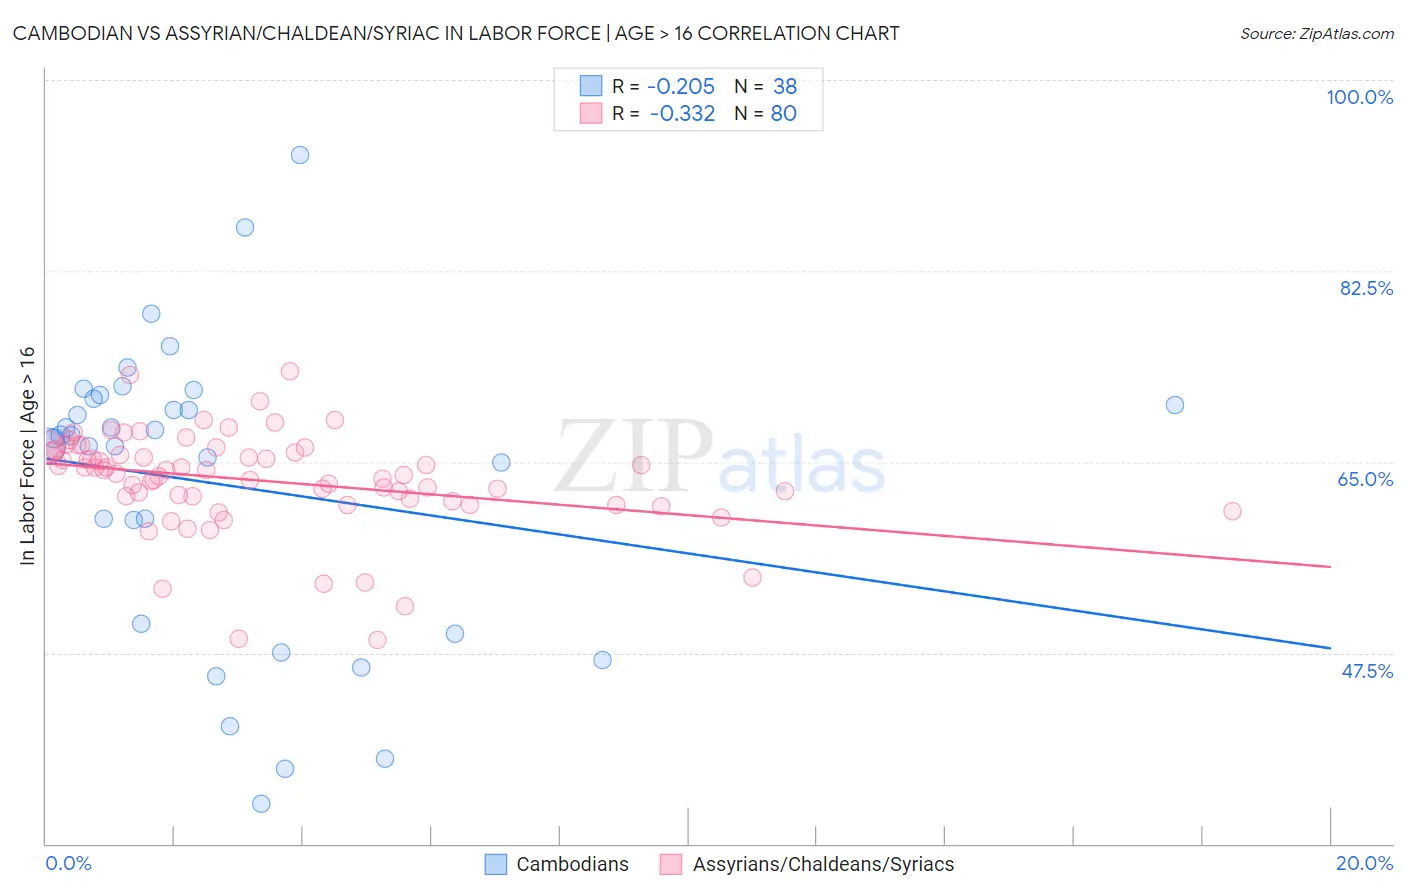
Cambodian vs Assyrian/Chaldean/Syriac In Labor Force | Age > 16 Correlation Chart
The statistical analysis conducted on geographies consisting of 102,521,417 people shows a weak negative correlation between the proportion of Cambodians and labor force participation rate among population ages 16 and over in the United States with a correlation coefficient (R) of -0.205 and weighted average of 67.4%. Similarly, the statistical analysis conducted on geographies consisting of 110,318,125 people shows a mild negative correlation between the proportion of Assyrians/Chaldeans/Syriacs and labor force participation rate among population ages 16 and over in the United States with a correlation coefficient (R) of -0.332 and weighted average of 64.0%, a difference of 5.3%.
In Labor Force | Age > 16 Correlation Summary
| Measurement | Cambodian | Assyrian/Chaldean/Syriac |
| Minimum | 33.7% | 48.7% |
| Maximum | 93.1% | 73.3% |
| Range | 59.4% | 24.6% |
| Mean | 63.0% | 63.3% |
| Median | 67.3% | 64.1% |
| Interquartile 25% (IQ1) | 50.2% | 61.5% |
| Interquartile 75% (IQ3) | 70.8% | 66.0% |
| Interquartile Range (IQR) | 20.6% | 4.5% |
| Standard Deviation (Sample) | 13.6% | 4.6% |
| Standard Deviation (Population) | 13.4% | 4.6% |
Similar Demographics by In Labor Force | Age > 16
Demographics Similar to Cambodians by In Labor Force | Age > 16
In terms of in labor force | age > 16, the demographic groups most similar to Cambodians are Ugandan (67.4%, a difference of 0.060%), Immigrants from Africa (67.4%, a difference of 0.090%), Immigrants from Uganda (67.5%, a difference of 0.12%), Immigrants from Cabo Verde (67.3%, a difference of 0.12%), and Tongan (67.5%, a difference of 0.18%).
| Demographics | Rating | Rank | In Labor Force | Age > 16 |
| Immigrants | Sudan | 100.0 /100 | #16 | Exceptional 67.7% |
| Immigrants | India | 100.0 /100 | #17 | Exceptional 67.6% |
| Immigrants | Liberia | 100.0 /100 | #18 | Exceptional 67.6% |
| Kenyans | 100.0 /100 | #19 | Exceptional 67.6% |
| Immigrants | Kenya | 100.0 /100 | #20 | Exceptional 67.6% |
| Tongans | 100.0 /100 | #21 | Exceptional 67.5% |
| Immigrants | Uganda | 100.0 /100 | #22 | Exceptional 67.5% |
| Cambodians | 100.0 /100 | #23 | Exceptional 67.4% |
| Ugandans | 100.0 /100 | #24 | Exceptional 67.4% |
| Immigrants | Africa | 100.0 /100 | #25 | Exceptional 67.4% |
| Immigrants | Cabo Verde | 100.0 /100 | #26 | Exceptional 67.3% |
| Zimbabweans | 100.0 /100 | #27 | Exceptional 67.3% |
| Immigrants | Morocco | 100.0 /100 | #28 | Exceptional 67.2% |
| Thais | 100.0 /100 | #29 | Exceptional 67.2% |
| Immigrants | Zaire | 100.0 /100 | #30 | Exceptional 67.2% |
Demographics Similar to Assyrians/Chaldeans/Syriacs by In Labor Force | Age > 16
In terms of in labor force | age > 16, the demographic groups most similar to Assyrians/Chaldeans/Syriacs are Immigrants from Bahamas (64.0%, a difference of 0.020%), Welsh (64.0%, a difference of 0.030%), Immigrants from St. Vincent and the Grenadines (64.0%, a difference of 0.040%), French Canadian (64.0%, a difference of 0.040%), and Mexican (64.1%, a difference of 0.050%).
| Demographics | Rating | Rank | In Labor Force | Age > 16 |
| Dominicans | 0.4 /100 | #271 | Tragic 64.1% |
| Native Hawaiians | 0.3 /100 | #272 | Tragic 64.1% |
| Hmong | 0.3 /100 | #273 | Tragic 64.1% |
| Immigrants | Cuba | 0.3 /100 | #274 | Tragic 64.1% |
| Mexicans | 0.3 /100 | #275 | Tragic 64.1% |
| French American Indians | 0.3 /100 | #276 | Tragic 64.1% |
| Immigrants | Bahamas | 0.3 /100 | #277 | Tragic 64.0% |
| Assyrians/Chaldeans/Syriacs | 0.3 /100 | #278 | Tragic 64.0% |
| Welsh | 0.2 /100 | #279 | Tragic 64.0% |
| Immigrants | St. Vincent and the Grenadines | 0.2 /100 | #280 | Tragic 64.0% |
| French Canadians | 0.2 /100 | #281 | Tragic 64.0% |
| Immigrants | Guyana | 0.2 /100 | #282 | Tragic 64.0% |
| Immigrants | Germany | 0.1 /100 | #283 | Tragic 63.9% |
| French | 0.1 /100 | #284 | Tragic 63.9% |
| Slovaks | 0.1 /100 | #285 | Tragic 63.9% |