Immigrants from Switzerland vs Assyrian/Chaldean/Syriac In Labor Force | Age > 16
COMPARE
Immigrants from Switzerland
Assyrian/Chaldean/Syriac
In Labor Force | Age > 16
In Labor Force | Age > 16 Comparison
Immigrants from Switzerland
Assyrians/Chaldeans/Syriacs
65.0%
IN LABOR FORCE | AGE > 16
38.2/ 100
METRIC RATING
186th/ 347
METRIC RANK
64.0%
IN LABOR FORCE | AGE > 16
0.3/ 100
METRIC RATING
278th/ 347
METRIC RANK
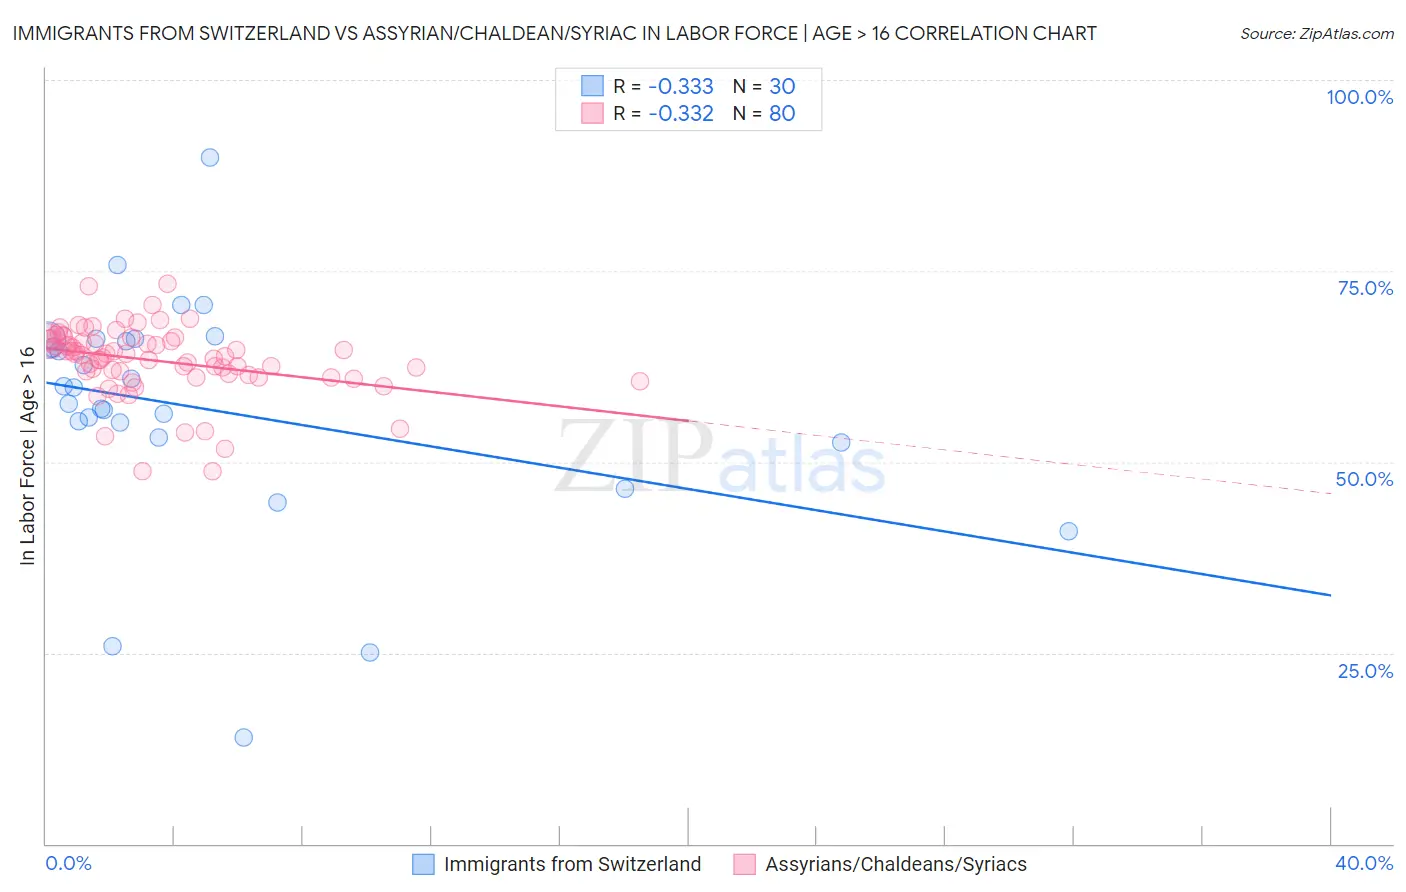
Immigrants from Switzerland vs Assyrian/Chaldean/Syriac In Labor Force | Age > 16 Correlation Chart
The statistical analysis conducted on geographies consisting of 148,083,583 people shows a mild negative correlation between the proportion of Immigrants from Switzerland and labor force participation rate among population ages 16 and over in the United States with a correlation coefficient (R) of -0.333 and weighted average of 65.0%. Similarly, the statistical analysis conducted on geographies consisting of 110,318,125 people shows a mild negative correlation between the proportion of Assyrians/Chaldeans/Syriacs and labor force participation rate among population ages 16 and over in the United States with a correlation coefficient (R) of -0.332 and weighted average of 64.0%, a difference of 1.6%.
In Labor Force | Age > 16 Correlation Summary
| Measurement | Immigrants from Switzerland | Assyrian/Chaldean/Syriac |
| Minimum | 13.9% | 48.7% |
| Maximum | 89.9% | 73.3% |
| Range | 76.0% | 24.6% |
| Mean | 56.9% | 63.3% |
| Median | 58.7% | 64.1% |
| Interquartile 25% (IQ1) | 53.2% | 61.5% |
| Interquartile 75% (IQ3) | 65.9% | 66.0% |
| Interquartile Range (IQR) | 12.7% | 4.5% |
| Standard Deviation (Sample) | 15.3% | 4.6% |
| Standard Deviation (Population) | 15.1% | 4.6% |
Similar Demographics by In Labor Force | Age > 16
Demographics Similar to Immigrants from Switzerland by In Labor Force | Age > 16
In terms of in labor force | age > 16, the demographic groups most similar to Immigrants from Switzerland are Carpatho Rusyn (65.0%, a difference of 0.020%), Syrian (65.0%, a difference of 0.020%), Immigrants from Nicaragua (65.1%, a difference of 0.030%), Soviet Union (65.0%, a difference of 0.030%), and Immigrants from Croatia (65.0%, a difference of 0.030%).
| Demographics | Rating | Rank | In Labor Force | Age > 16 |
| Immigrants | Haiti | 43.3 /100 | #179 | Average 65.1% |
| Immigrants | Latvia | 42.9 /100 | #180 | Average 65.1% |
| Immigrants | Panama | 42.4 /100 | #181 | Average 65.1% |
| Immigrants | Nicaragua | 41.1 /100 | #182 | Average 65.1% |
| Soviet Union | 40.5 /100 | #183 | Average 65.0% |
| Carpatho Rusyns | 40.0 /100 | #184 | Average 65.0% |
| Syrians | 40.0 /100 | #185 | Average 65.0% |
| Immigrants | Switzerland | 38.2 /100 | #186 | Fair 65.0% |
| Immigrants | Croatia | 35.7 /100 | #187 | Fair 65.0% |
| Immigrants | Portugal | 34.8 /100 | #188 | Fair 65.0% |
| Immigrants | Greece | 34.3 /100 | #189 | Fair 65.0% |
| Barbadians | 33.9 /100 | #190 | Fair 65.0% |
| Scandinavians | 33.7 /100 | #191 | Fair 65.0% |
| Immigrants | Fiji | 33.7 /100 | #192 | Fair 65.0% |
| Immigrants | Europe | 33.6 /100 | #193 | Fair 65.0% |
Demographics Similar to Assyrians/Chaldeans/Syriacs by In Labor Force | Age > 16
In terms of in labor force | age > 16, the demographic groups most similar to Assyrians/Chaldeans/Syriacs are Immigrants from Bahamas (64.0%, a difference of 0.020%), Welsh (64.0%, a difference of 0.030%), Immigrants from St. Vincent and the Grenadines (64.0%, a difference of 0.040%), French Canadian (64.0%, a difference of 0.040%), and Mexican (64.1%, a difference of 0.050%).
| Demographics | Rating | Rank | In Labor Force | Age > 16 |
| Dominicans | 0.4 /100 | #271 | Tragic 64.1% |
| Native Hawaiians | 0.3 /100 | #272 | Tragic 64.1% |
| Hmong | 0.3 /100 | #273 | Tragic 64.1% |
| Immigrants | Cuba | 0.3 /100 | #274 | Tragic 64.1% |
| Mexicans | 0.3 /100 | #275 | Tragic 64.1% |
| French American Indians | 0.3 /100 | #276 | Tragic 64.1% |
| Immigrants | Bahamas | 0.3 /100 | #277 | Tragic 64.0% |
| Assyrians/Chaldeans/Syriacs | 0.3 /100 | #278 | Tragic 64.0% |
| Welsh | 0.2 /100 | #279 | Tragic 64.0% |
| Immigrants | St. Vincent and the Grenadines | 0.2 /100 | #280 | Tragic 64.0% |
| French Canadians | 0.2 /100 | #281 | Tragic 64.0% |
| Immigrants | Guyana | 0.2 /100 | #282 | Tragic 64.0% |
| Immigrants | Germany | 0.1 /100 | #283 | Tragic 63.9% |
| French | 0.1 /100 | #284 | Tragic 63.9% |
| Slovaks | 0.1 /100 | #285 | Tragic 63.9% |