Pennsylvania German vs Assyrian/Chaldean/Syriac In Labor Force | Age > 16
COMPARE
Pennsylvania German
Assyrian/Chaldean/Syriac
In Labor Force | Age > 16
In Labor Force | Age > 16 Comparison
Pennsylvania Germans
Assyrians/Chaldeans/Syriacs
63.4%
IN LABOR FORCE | AGE > 16
0.0/ 100
METRIC RATING
308th/ 347
METRIC RANK
64.0%
IN LABOR FORCE | AGE > 16
0.3/ 100
METRIC RATING
278th/ 347
METRIC RANK
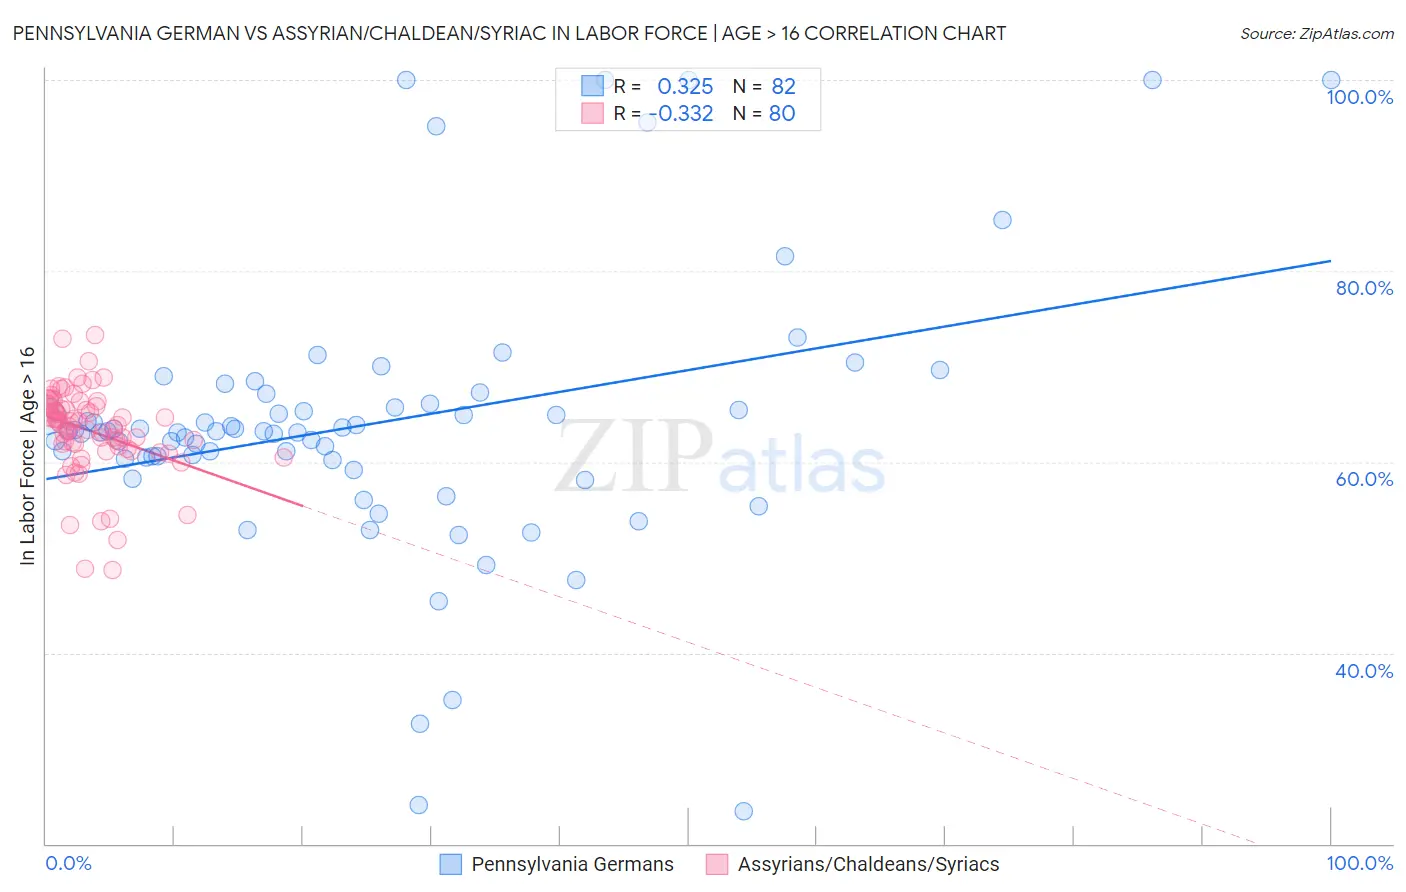
Pennsylvania German vs Assyrian/Chaldean/Syriac In Labor Force | Age > 16 Correlation Chart
The statistical analysis conducted on geographies consisting of 234,107,646 people shows a mild positive correlation between the proportion of Pennsylvania Germans and labor force participation rate among population ages 16 and over in the United States with a correlation coefficient (R) of 0.325 and weighted average of 63.4%. Similarly, the statistical analysis conducted on geographies consisting of 110,318,125 people shows a mild negative correlation between the proportion of Assyrians/Chaldeans/Syriacs and labor force participation rate among population ages 16 and over in the United States with a correlation coefficient (R) of -0.332 and weighted average of 64.0%, a difference of 1.1%.
In Labor Force | Age > 16 Correlation Summary
| Measurement | Pennsylvania German | Assyrian/Chaldean/Syriac |
| Minimum | 23.4% | 48.7% |
| Maximum | 100.0% | 73.3% |
| Range | 76.6% | 24.6% |
| Mean | 64.0% | 63.3% |
| Median | 63.2% | 64.1% |
| Interquartile 25% (IQ1) | 60.3% | 61.5% |
| Interquartile 75% (IQ3) | 66.1% | 66.0% |
| Interquartile Range (IQR) | 5.8% | 4.5% |
| Standard Deviation (Sample) | 14.3% | 4.6% |
| Standard Deviation (Population) | 14.2% | 4.6% |
Similar Demographics by In Labor Force | Age > 16
Demographics Similar to Pennsylvania Germans by In Labor Force | Age > 16
In terms of in labor force | age > 16, the demographic groups most similar to Pennsylvania Germans are Central American Indian (63.4%, a difference of 0.050%), Black/African American (63.4%, a difference of 0.080%), Scotch-Irish (63.3%, a difference of 0.13%), Osage (63.5%, a difference of 0.18%), and Shoshone (63.2%, a difference of 0.20%).
| Demographics | Rating | Rank | In Labor Force | Age > 16 |
| Spanish Americans | 0.0 /100 | #301 | Tragic 63.6% |
| Delaware | 0.0 /100 | #302 | Tragic 63.6% |
| Cree | 0.0 /100 | #303 | Tragic 63.5% |
| Immigrants | Nonimmigrants | 0.0 /100 | #304 | Tragic 63.5% |
| Osage | 0.0 /100 | #305 | Tragic 63.5% |
| Blacks/African Americans | 0.0 /100 | #306 | Tragic 63.4% |
| Central American Indians | 0.0 /100 | #307 | Tragic 63.4% |
| Pennsylvania Germans | 0.0 /100 | #308 | Tragic 63.4% |
| Scotch-Irish | 0.0 /100 | #309 | Tragic 63.3% |
| Shoshone | 0.0 /100 | #310 | Tragic 63.2% |
| Blackfeet | 0.0 /100 | #311 | Tragic 63.2% |
| Iroquois | 0.0 /100 | #312 | Tragic 63.2% |
| Chippewa | 0.0 /100 | #313 | Tragic 63.1% |
| Yaqui | 0.0 /100 | #314 | Tragic 63.0% |
| Potawatomi | 0.0 /100 | #315 | Tragic 62.8% |
Demographics Similar to Assyrians/Chaldeans/Syriacs by In Labor Force | Age > 16
In terms of in labor force | age > 16, the demographic groups most similar to Assyrians/Chaldeans/Syriacs are Immigrants from Bahamas (64.0%, a difference of 0.020%), Welsh (64.0%, a difference of 0.030%), Immigrants from St. Vincent and the Grenadines (64.0%, a difference of 0.040%), French Canadian (64.0%, a difference of 0.040%), and Mexican (64.1%, a difference of 0.050%).
| Demographics | Rating | Rank | In Labor Force | Age > 16 |
| Dominicans | 0.4 /100 | #271 | Tragic 64.1% |
| Native Hawaiians | 0.3 /100 | #272 | Tragic 64.1% |
| Hmong | 0.3 /100 | #273 | Tragic 64.1% |
| Immigrants | Cuba | 0.3 /100 | #274 | Tragic 64.1% |
| Mexicans | 0.3 /100 | #275 | Tragic 64.1% |
| French American Indians | 0.3 /100 | #276 | Tragic 64.1% |
| Immigrants | Bahamas | 0.3 /100 | #277 | Tragic 64.0% |
| Assyrians/Chaldeans/Syriacs | 0.3 /100 | #278 | Tragic 64.0% |
| Welsh | 0.2 /100 | #279 | Tragic 64.0% |
| Immigrants | St. Vincent and the Grenadines | 0.2 /100 | #280 | Tragic 64.0% |
| French Canadians | 0.2 /100 | #281 | Tragic 64.0% |
| Immigrants | Guyana | 0.2 /100 | #282 | Tragic 64.0% |
| Immigrants | Germany | 0.1 /100 | #283 | Tragic 63.9% |
| French | 0.1 /100 | #284 | Tragic 63.9% |
| Slovaks | 0.1 /100 | #285 | Tragic 63.9% |