Ukrainian vs Cheyenne In Labor Force | Age 16-19
COMPARE
Ukrainian
Cheyenne
In Labor Force | Age 16-19
In Labor Force | Age 16-19 Comparison
Ukrainians
Cheyenne
38.3%
IN LABOR FORCE | AGE 16-19
97.6/ 100
METRIC RATING
120th/ 347
METRIC RANK
37.9%
IN LABOR FORCE | AGE 16-19
94.6/ 100
METRIC RATING
133rd/ 347
METRIC RANK
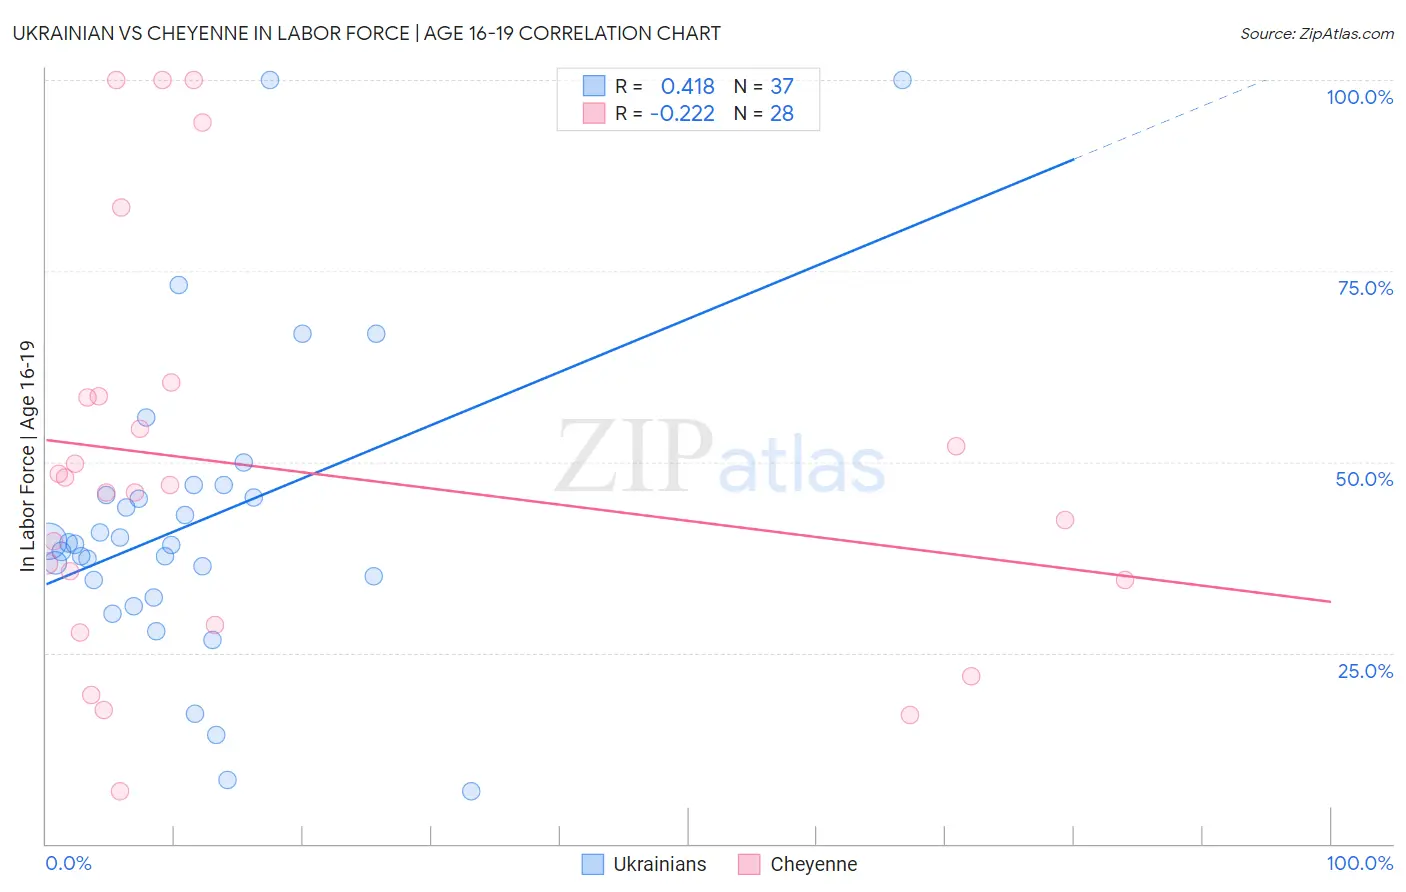
Ukrainian vs Cheyenne In Labor Force | Age 16-19 Correlation Chart
The statistical analysis conducted on geographies consisting of 447,440,014 people shows a moderate positive correlation between the proportion of Ukrainians and labor force participation rate among population between the ages 16 and 19 in the United States with a correlation coefficient (R) of 0.418 and weighted average of 38.3%. Similarly, the statistical analysis conducted on geographies consisting of 80,651,378 people shows a weak negative correlation between the proportion of Cheyenne and labor force participation rate among population between the ages 16 and 19 in the United States with a correlation coefficient (R) of -0.222 and weighted average of 37.9%, a difference of 1.0%.
In Labor Force | Age 16-19 Correlation Summary
| Measurement | Ukrainian | Cheyenne |
| Minimum | 6.9% | 6.9% |
| Maximum | 100.0% | 100.0% |
| Range | 93.1% | 93.1% |
| Mean | 42.0% | 49.1% |
| Median | 39.2% | 46.5% |
| Interquartile 25% (IQ1) | 33.4% | 31.6% |
| Interquartile 75% (IQ3) | 46.3% | 58.6% |
| Interquartile Range (IQR) | 12.9% | 27.0% |
| Standard Deviation (Sample) | 19.8% | 26.1% |
| Standard Deviation (Population) | 19.5% | 25.6% |
Demographics Similar to Ukrainians and Cheyenne by In Labor Force | Age 16-19
In terms of in labor force | age 16-19, the demographic groups most similar to Ukrainians are Assyrian/Chaldean/Syriac (38.3%, a difference of 0.090%), Immigrants from Nepal (38.3%, a difference of 0.10%), Chickasaw (38.3%, a difference of 0.11%), Ethiopian (38.2%, a difference of 0.11%), and Guamanian/Chamorro (38.2%, a difference of 0.13%). Similarly, the demographic groups most similar to Cheyenne are Immigrants from Oceania (37.9%, a difference of 0.020%), Immigrants from Austria (37.9%, a difference of 0.11%), Immigrants from Zimbabwe (38.0%, a difference of 0.20%), Immigrants from Netherlands (37.8%, a difference of 0.21%), and Spaniard (38.0%, a difference of 0.23%).
| Demographics | Rating | Rank | In Labor Force | Age 16-19 |
| Colville | 97.9 /100 | #116 | Exceptional 38.3% |
| Chickasaw | 97.8 /100 | #117 | Exceptional 38.3% |
| Immigrants | Nepal | 97.8 /100 | #118 | Exceptional 38.3% |
| Assyrians/Chaldeans/Syriacs | 97.8 /100 | #119 | Exceptional 38.3% |
| Ukrainians | 97.6 /100 | #120 | Exceptional 38.3% |
| Ethiopians | 97.4 /100 | #121 | Exceptional 38.2% |
| Guamanians/Chamorros | 97.4 /100 | #122 | Exceptional 38.2% |
| Seminole | 96.7 /100 | #123 | Exceptional 38.1% |
| Immigrants | England | 96.4 /100 | #124 | Exceptional 38.1% |
| Immigrants | Africa | 96.1 /100 | #125 | Exceptional 38.0% |
| Africans | 95.6 /100 | #126 | Exceptional 38.0% |
| Choctaw | 95.6 /100 | #127 | Exceptional 38.0% |
| New Zealanders | 95.6 /100 | #128 | Exceptional 38.0% |
| Spaniards | 95.5 /100 | #129 | Exceptional 38.0% |
| Immigrants | Zimbabwe | 95.4 /100 | #130 | Exceptional 38.0% |
| Immigrants | Austria | 95.0 /100 | #131 | Exceptional 37.9% |
| Immigrants | Oceania | 94.7 /100 | #132 | Exceptional 37.9% |
| Cheyenne | 94.6 /100 | #133 | Exceptional 37.9% |
| Immigrants | Netherlands | 93.7 /100 | #134 | Exceptional 37.8% |
| Macedonians | 93.4 /100 | #135 | Exceptional 37.8% |
| Australians | 93.2 /100 | #136 | Exceptional 37.8% |