Shoshone vs Cheyenne In Labor Force | Age 16-19
COMPARE
Shoshone
Cheyenne
In Labor Force | Age 16-19
In Labor Force | Age 16-19 Comparison
Shoshone
Cheyenne
39.3%
IN LABOR FORCE | AGE 16-19
99.7/ 100
METRIC RATING
81st/ 347
METRIC RANK
37.9%
IN LABOR FORCE | AGE 16-19
94.6/ 100
METRIC RATING
133rd/ 347
METRIC RANK
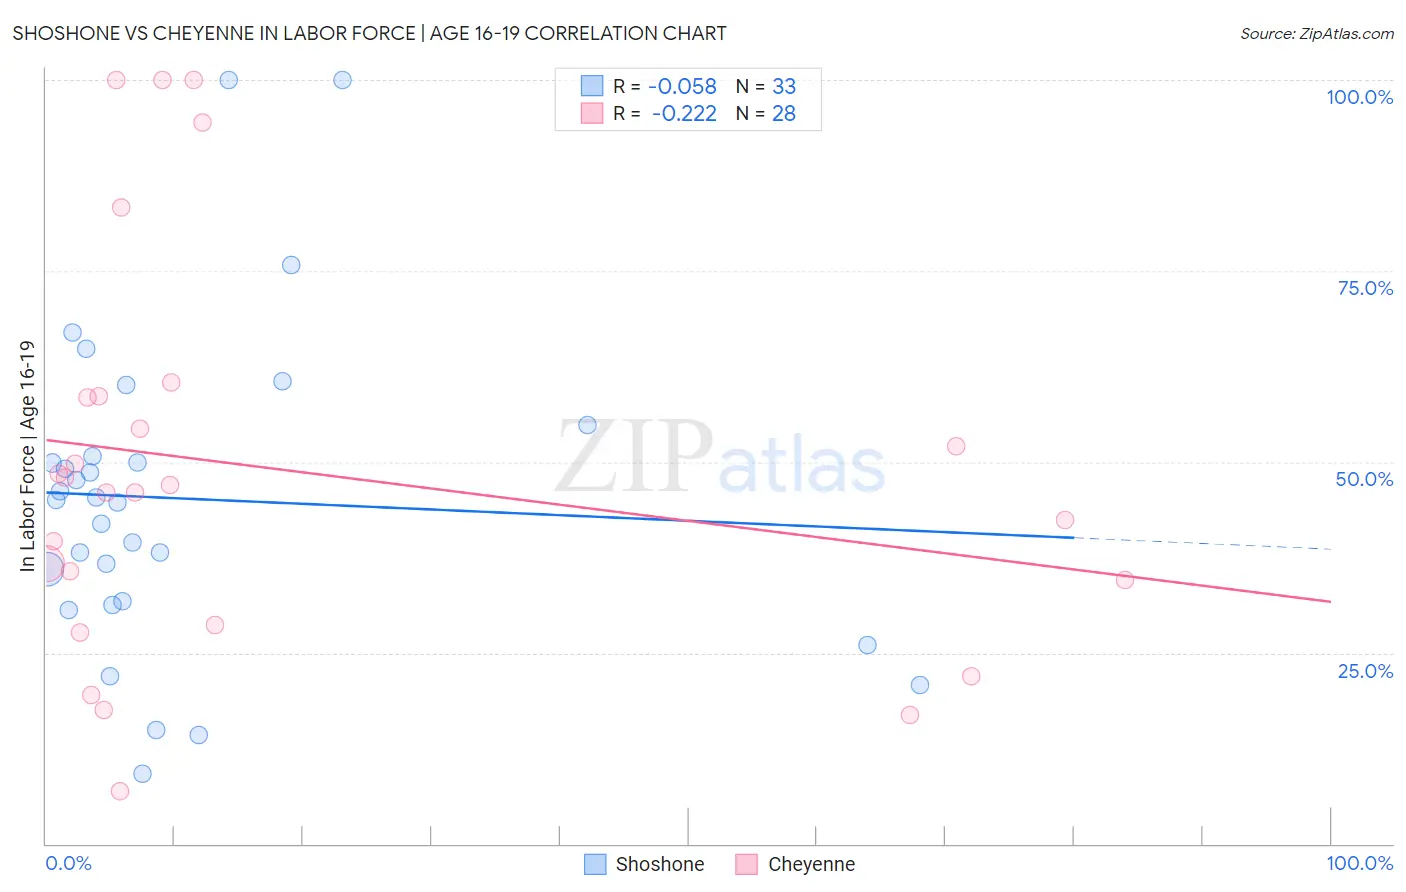
Shoshone vs Cheyenne In Labor Force | Age 16-19 Correlation Chart
The statistical analysis conducted on geographies consisting of 66,564,469 people shows a slight negative correlation between the proportion of Shoshone and labor force participation rate among population between the ages 16 and 19 in the United States with a correlation coefficient (R) of -0.058 and weighted average of 39.3%. Similarly, the statistical analysis conducted on geographies consisting of 80,651,378 people shows a weak negative correlation between the proportion of Cheyenne and labor force participation rate among population between the ages 16 and 19 in the United States with a correlation coefficient (R) of -0.222 and weighted average of 37.9%, a difference of 3.7%.
In Labor Force | Age 16-19 Correlation Summary
| Measurement | Shoshone | Cheyenne |
| Minimum | 9.1% | 6.9% |
| Maximum | 100.0% | 100.0% |
| Range | 90.9% | 93.1% |
| Mean | 45.2% | 49.1% |
| Median | 45.1% | 46.5% |
| Interquartile 25% (IQ1) | 31.5% | 31.6% |
| Interquartile 75% (IQ3) | 52.7% | 58.6% |
| Interquartile Range (IQR) | 21.2% | 27.0% |
| Standard Deviation (Sample) | 20.9% | 26.1% |
| Standard Deviation (Population) | 20.6% | 25.6% |
Similar Demographics by In Labor Force | Age 16-19
Demographics Similar to Shoshone by In Labor Force | Age 16-19
In terms of in labor force | age 16-19, the demographic groups most similar to Shoshone are Basque (39.3%, a difference of 0.060%), Spanish (39.3%, a difference of 0.080%), Immigrants from Uganda (39.2%, a difference of 0.21%), Immigrants from Iraq (39.4%, a difference of 0.28%), and Creek (39.1%, a difference of 0.36%).
| Demographics | Rating | Rank | In Labor Force | Age 16-19 |
| Hungarians | 99.9 /100 | #74 | Exceptional 39.8% |
| French American Indians | 99.9 /100 | #75 | Exceptional 39.8% |
| Malaysians | 99.9 /100 | #76 | Exceptional 39.7% |
| Immigrants | Portugal | 99.9 /100 | #77 | Exceptional 39.7% |
| Austrians | 99.8 /100 | #78 | Exceptional 39.5% |
| Marshallese | 99.8 /100 | #79 | Exceptional 39.5% |
| Immigrants | Iraq | 99.8 /100 | #80 | Exceptional 39.4% |
| Shoshone | 99.7 /100 | #81 | Exceptional 39.3% |
| Basques | 99.7 /100 | #82 | Exceptional 39.3% |
| Spanish | 99.7 /100 | #83 | Exceptional 39.3% |
| Immigrants | Uganda | 99.7 /100 | #84 | Exceptional 39.2% |
| Creek | 99.6 /100 | #85 | Exceptional 39.1% |
| Samoans | 99.6 /100 | #86 | Exceptional 39.1% |
| Immigrants | Germany | 99.6 /100 | #87 | Exceptional 39.1% |
| Puget Sound Salish | 99.6 /100 | #88 | Exceptional 39.1% |
Demographics Similar to Cheyenne by In Labor Force | Age 16-19
In terms of in labor force | age 16-19, the demographic groups most similar to Cheyenne are Immigrants from Oceania (37.9%, a difference of 0.020%), Immigrants from Austria (37.9%, a difference of 0.11%), Immigrants from Zimbabwe (38.0%, a difference of 0.20%), Immigrants from Netherlands (37.8%, a difference of 0.21%), and Spaniard (38.0%, a difference of 0.23%).
| Demographics | Rating | Rank | In Labor Force | Age 16-19 |
| Africans | 95.6 /100 | #126 | Exceptional 38.0% |
| Choctaw | 95.6 /100 | #127 | Exceptional 38.0% |
| New Zealanders | 95.6 /100 | #128 | Exceptional 38.0% |
| Spaniards | 95.5 /100 | #129 | Exceptional 38.0% |
| Immigrants | Zimbabwe | 95.4 /100 | #130 | Exceptional 38.0% |
| Immigrants | Austria | 95.0 /100 | #131 | Exceptional 37.9% |
| Immigrants | Oceania | 94.7 /100 | #132 | Exceptional 37.9% |
| Cheyenne | 94.6 /100 | #133 | Exceptional 37.9% |
| Immigrants | Netherlands | 93.7 /100 | #134 | Exceptional 37.8% |
| Macedonians | 93.4 /100 | #135 | Exceptional 37.8% |
| Australians | 93.2 /100 | #136 | Exceptional 37.8% |
| Cajuns | 93.2 /100 | #137 | Exceptional 37.8% |
| Comanche | 91.9 /100 | #138 | Exceptional 37.7% |
| Immigrants | Moldova | 91.9 /100 | #139 | Exceptional 37.7% |
| Estonians | 91.7 /100 | #140 | Exceptional 37.7% |