Ukrainian vs Menominee In Labor Force | Age 16-19
COMPARE
Ukrainian
Menominee
In Labor Force | Age 16-19
In Labor Force | Age 16-19 Comparison
Ukrainians
Menominee
38.3%
IN LABOR FORCE | AGE 16-19
97.6/ 100
METRIC RATING
120th/ 347
METRIC RANK
33.9%
IN LABOR FORCE | AGE 16-19
0.3/ 100
METRIC RATING
277th/ 347
METRIC RANK
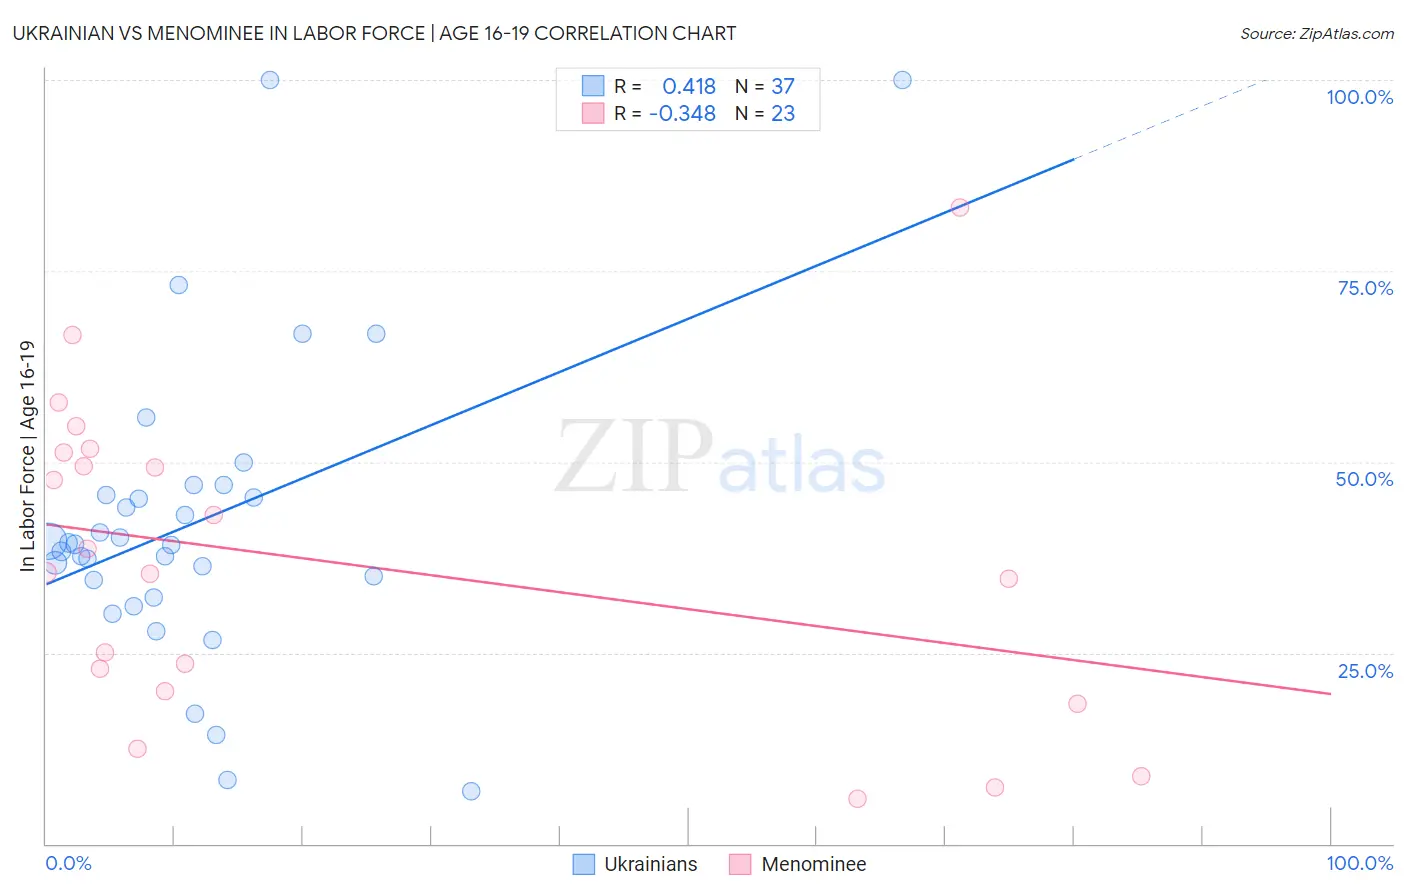
Ukrainian vs Menominee In Labor Force | Age 16-19 Correlation Chart
The statistical analysis conducted on geographies consisting of 447,440,014 people shows a moderate positive correlation between the proportion of Ukrainians and labor force participation rate among population between the ages 16 and 19 in the United States with a correlation coefficient (R) of 0.418 and weighted average of 38.3%. Similarly, the statistical analysis conducted on geographies consisting of 45,771,172 people shows a mild negative correlation between the proportion of Menominee and labor force participation rate among population between the ages 16 and 19 in the United States with a correlation coefficient (R) of -0.348 and weighted average of 33.9%, a difference of 13.1%.
In Labor Force | Age 16-19 Correlation Summary
| Measurement | Ukrainian | Menominee |
| Minimum | 6.9% | 5.9% |
| Maximum | 100.0% | 83.3% |
| Range | 93.1% | 77.4% |
| Mean | 42.0% | 36.7% |
| Median | 39.2% | 35.5% |
| Interquartile 25% (IQ1) | 33.4% | 20.0% |
| Interquartile 75% (IQ3) | 46.3% | 51.3% |
| Interquartile Range (IQR) | 12.9% | 31.3% |
| Standard Deviation (Sample) | 19.8% | 20.3% |
| Standard Deviation (Population) | 19.5% | 19.8% |
Similar Demographics by In Labor Force | Age 16-19
Demographics Similar to Ukrainians by In Labor Force | Age 16-19
In terms of in labor force | age 16-19, the demographic groups most similar to Ukrainians are Assyrian/Chaldean/Syriac (38.3%, a difference of 0.090%), Immigrants from Nepal (38.3%, a difference of 0.10%), Chickasaw (38.3%, a difference of 0.11%), Ethiopian (38.2%, a difference of 0.11%), and Guamanian/Chamorro (38.2%, a difference of 0.13%).
| Demographics | Rating | Rank | In Labor Force | Age 16-19 |
| Sub-Saharan Africans | 98.3 /100 | #113 | Exceptional 38.4% |
| Hawaiians | 98.2 /100 | #114 | Exceptional 38.4% |
| Bulgarians | 97.9 /100 | #115 | Exceptional 38.3% |
| Colville | 97.9 /100 | #116 | Exceptional 38.3% |
| Chickasaw | 97.8 /100 | #117 | Exceptional 38.3% |
| Immigrants | Nepal | 97.8 /100 | #118 | Exceptional 38.3% |
| Assyrians/Chaldeans/Syriacs | 97.8 /100 | #119 | Exceptional 38.3% |
| Ukrainians | 97.6 /100 | #120 | Exceptional 38.3% |
| Ethiopians | 97.4 /100 | #121 | Exceptional 38.2% |
| Guamanians/Chamorros | 97.4 /100 | #122 | Exceptional 38.2% |
| Seminole | 96.7 /100 | #123 | Exceptional 38.1% |
| Immigrants | England | 96.4 /100 | #124 | Exceptional 38.1% |
| Immigrants | Africa | 96.1 /100 | #125 | Exceptional 38.0% |
| Africans | 95.6 /100 | #126 | Exceptional 38.0% |
| Choctaw | 95.6 /100 | #127 | Exceptional 38.0% |
Demographics Similar to Menominee by In Labor Force | Age 16-19
In terms of in labor force | age 16-19, the demographic groups most similar to Menominee are Colombian (33.8%, a difference of 0.070%), Paraguayan (33.8%, a difference of 0.080%), Taiwanese (33.8%, a difference of 0.090%), Cypriot (33.8%, a difference of 0.10%), and Immigrants from Latin America (33.9%, a difference of 0.11%).
| Demographics | Rating | Rank | In Labor Force | Age 16-19 |
| Immigrants | Russia | 0.4 /100 | #270 | Tragic 34.1% |
| Central American Indians | 0.4 /100 | #271 | Tragic 34.1% |
| Asians | 0.4 /100 | #272 | Tragic 34.1% |
| Immigrants | Panama | 0.4 /100 | #273 | Tragic 34.0% |
| Venezuelans | 0.3 /100 | #274 | Tragic 34.0% |
| Immigrants | Fiji | 0.3 /100 | #275 | Tragic 33.9% |
| Immigrants | Latin America | 0.3 /100 | #276 | Tragic 33.9% |
| Menominee | 0.3 /100 | #277 | Tragic 33.9% |
| Colombians | 0.3 /100 | #278 | Tragic 33.8% |
| Paraguayans | 0.3 /100 | #279 | Tragic 33.8% |
| Taiwanese | 0.3 /100 | #280 | Tragic 33.8% |
| Cypriots | 0.3 /100 | #281 | Tragic 33.8% |
| Immigrants | Korea | 0.3 /100 | #282 | Tragic 33.8% |
| Immigrants | Venezuela | 0.2 /100 | #283 | Tragic 33.7% |
| Immigrants | Spain | 0.2 /100 | #284 | Tragic 33.7% |