Immigrants from Costa Rica vs Cheyenne In Labor Force | Age 16-19
COMPARE
Immigrants from Costa Rica
Cheyenne
In Labor Force | Age 16-19
In Labor Force | Age 16-19 Comparison
Immigrants from Costa Rica
Cheyenne
35.6%
IN LABOR FORCE | AGE 16-19
10.7/ 100
METRIC RATING
217th/ 347
METRIC RANK
37.9%
IN LABOR FORCE | AGE 16-19
94.6/ 100
METRIC RATING
133rd/ 347
METRIC RANK
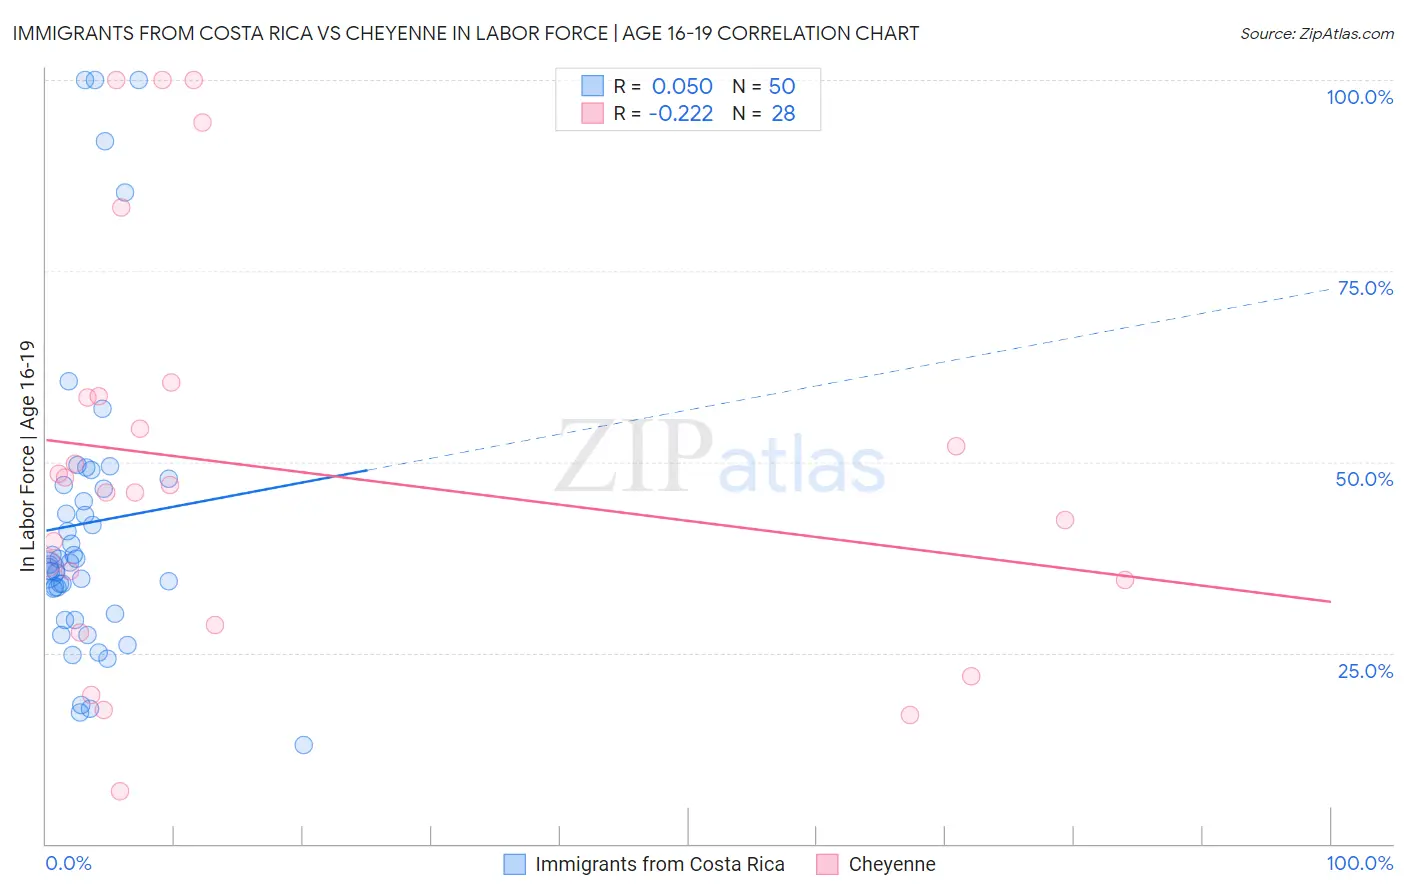
Immigrants from Costa Rica vs Cheyenne In Labor Force | Age 16-19 Correlation Chart
The statistical analysis conducted on geographies consisting of 204,218,033 people shows a slight positive correlation between the proportion of Immigrants from Costa Rica and labor force participation rate among population between the ages 16 and 19 in the United States with a correlation coefficient (R) of 0.050 and weighted average of 35.6%. Similarly, the statistical analysis conducted on geographies consisting of 80,651,378 people shows a weak negative correlation between the proportion of Cheyenne and labor force participation rate among population between the ages 16 and 19 in the United States with a correlation coefficient (R) of -0.222 and weighted average of 37.9%, a difference of 6.5%.
In Labor Force | Age 16-19 Correlation Summary
| Measurement | Immigrants from Costa Rica | Cheyenne |
| Minimum | 13.0% | 6.9% |
| Maximum | 100.0% | 100.0% |
| Range | 87.0% | 93.1% |
| Mean | 42.0% | 49.1% |
| Median | 36.7% | 46.5% |
| Interquartile 25% (IQ1) | 30.1% | 31.6% |
| Interquartile 75% (IQ3) | 46.9% | 58.6% |
| Interquartile Range (IQR) | 16.9% | 27.0% |
| Standard Deviation (Sample) | 20.6% | 26.1% |
| Standard Deviation (Population) | 20.4% | 25.6% |
Similar Demographics by In Labor Force | Age 16-19
Demographics Similar to Immigrants from Costa Rica by In Labor Force | Age 16-19
In terms of in labor force | age 16-19, the demographic groups most similar to Immigrants from Costa Rica are Dutch West Indian (35.6%, a difference of 0.0%), Immigrants from South Eastern Asia (35.6%, a difference of 0.020%), Apache (35.6%, a difference of 0.040%), Houma (35.6%, a difference of 0.050%), and Immigrants from Bolivia (35.6%, a difference of 0.050%).
| Demographics | Rating | Rank | In Labor Force | Age 16-19 |
| Immigrants | Switzerland | 11.9 /100 | #210 | Poor 35.6% |
| Mexicans | 11.9 /100 | #211 | Poor 35.6% |
| Houma | 11.0 /100 | #212 | Poor 35.6% |
| Immigrants | Bolivia | 11.0 /100 | #213 | Poor 35.6% |
| Apache | 11.0 /100 | #214 | Poor 35.6% |
| Immigrants | South Eastern Asia | 10.8 /100 | #215 | Poor 35.6% |
| Dutch West Indians | 10.7 /100 | #216 | Poor 35.6% |
| Immigrants | Costa Rica | 10.7 /100 | #217 | Poor 35.6% |
| Sri Lankans | 9.8 /100 | #218 | Tragic 35.5% |
| Guatemalans | 8.6 /100 | #219 | Tragic 35.5% |
| Immigrants | Bahamas | 8.3 /100 | #220 | Tragic 35.5% |
| Turks | 7.3 /100 | #221 | Tragic 35.4% |
| Immigrants | Ghana | 7.3 /100 | #222 | Tragic 35.4% |
| Ghanaians | 6.5 /100 | #223 | Tragic 35.3% |
| Hondurans | 6.5 /100 | #224 | Tragic 35.3% |
Demographics Similar to Cheyenne by In Labor Force | Age 16-19
In terms of in labor force | age 16-19, the demographic groups most similar to Cheyenne are Immigrants from Oceania (37.9%, a difference of 0.020%), Immigrants from Austria (37.9%, a difference of 0.11%), Immigrants from Zimbabwe (38.0%, a difference of 0.20%), Immigrants from Netherlands (37.8%, a difference of 0.21%), and Spaniard (38.0%, a difference of 0.23%).
| Demographics | Rating | Rank | In Labor Force | Age 16-19 |
| Africans | 95.6 /100 | #126 | Exceptional 38.0% |
| Choctaw | 95.6 /100 | #127 | Exceptional 38.0% |
| New Zealanders | 95.6 /100 | #128 | Exceptional 38.0% |
| Spaniards | 95.5 /100 | #129 | Exceptional 38.0% |
| Immigrants | Zimbabwe | 95.4 /100 | #130 | Exceptional 38.0% |
| Immigrants | Austria | 95.0 /100 | #131 | Exceptional 37.9% |
| Immigrants | Oceania | 94.7 /100 | #132 | Exceptional 37.9% |
| Cheyenne | 94.6 /100 | #133 | Exceptional 37.9% |
| Immigrants | Netherlands | 93.7 /100 | #134 | Exceptional 37.8% |
| Macedonians | 93.4 /100 | #135 | Exceptional 37.8% |
| Australians | 93.2 /100 | #136 | Exceptional 37.8% |
| Cajuns | 93.2 /100 | #137 | Exceptional 37.8% |
| Comanche | 91.9 /100 | #138 | Exceptional 37.7% |
| Immigrants | Moldova | 91.9 /100 | #139 | Exceptional 37.7% |
| Estonians | 91.7 /100 | #140 | Exceptional 37.7% |