Ukrainian vs Immigrants from Hong Kong In Labor Force | Age 16-19
COMPARE
Ukrainian
Immigrants from Hong Kong
In Labor Force | Age 16-19
In Labor Force | Age 16-19 Comparison
Ukrainians
Immigrants from Hong Kong
38.3%
IN LABOR FORCE | AGE 16-19
97.6/ 100
METRIC RATING
120th/ 347
METRIC RANK
30.5%
IN LABOR FORCE | AGE 16-19
0.0/ 100
METRIC RATING
333rd/ 347
METRIC RANK
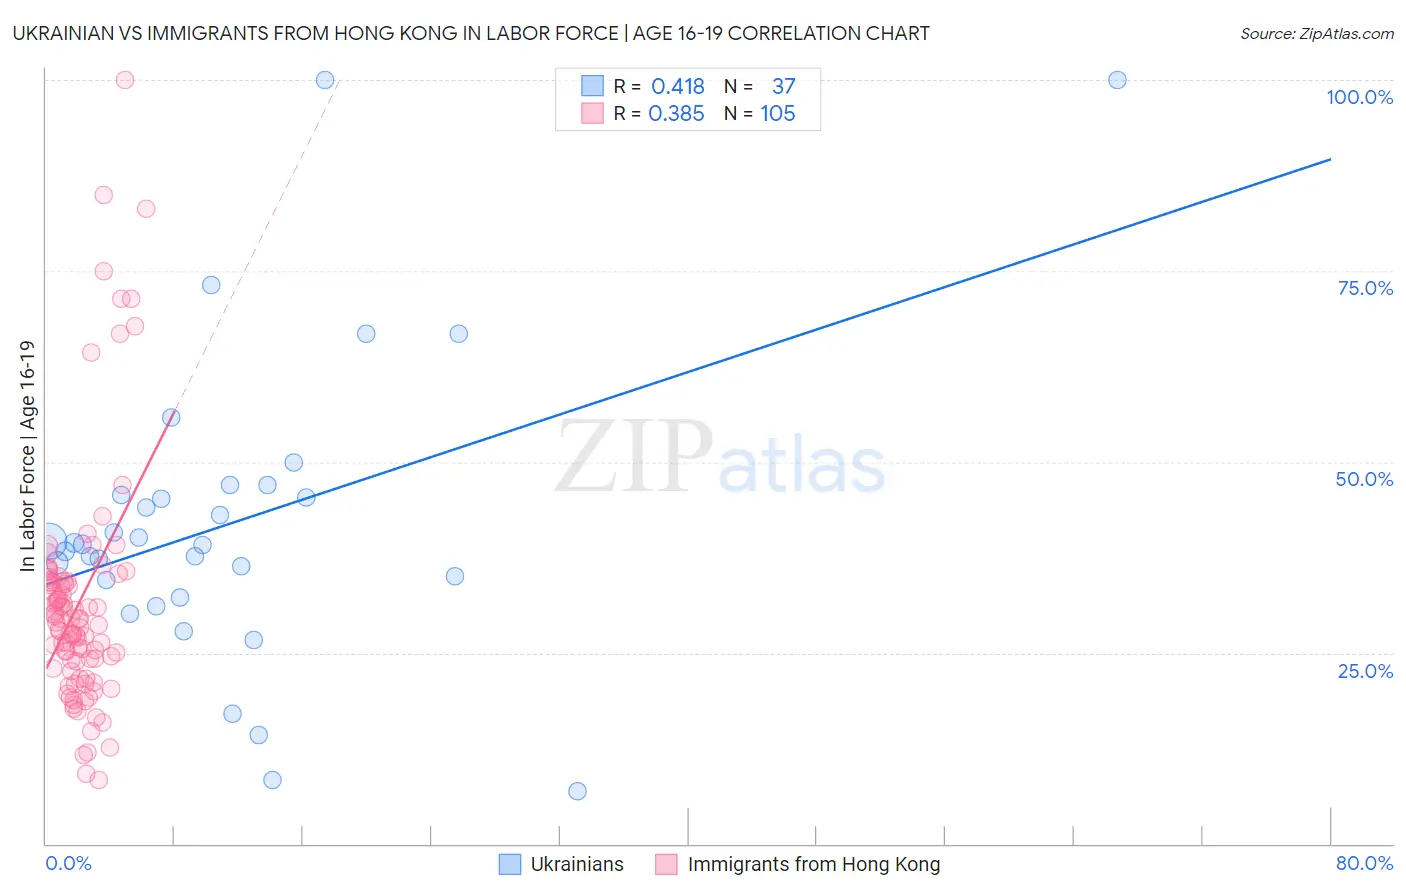
Ukrainian vs Immigrants from Hong Kong In Labor Force | Age 16-19 Correlation Chart
The statistical analysis conducted on geographies consisting of 447,440,014 people shows a moderate positive correlation between the proportion of Ukrainians and labor force participation rate among population between the ages 16 and 19 in the United States with a correlation coefficient (R) of 0.418 and weighted average of 38.3%. Similarly, the statistical analysis conducted on geographies consisting of 253,714,019 people shows a mild positive correlation between the proportion of Immigrants from Hong Kong and labor force participation rate among population between the ages 16 and 19 in the United States with a correlation coefficient (R) of 0.385 and weighted average of 30.5%, a difference of 25.6%.
In Labor Force | Age 16-19 Correlation Summary
| Measurement | Ukrainian | Immigrants from Hong Kong |
| Minimum | 6.9% | 8.3% |
| Maximum | 100.0% | 100.0% |
| Range | 93.1% | 91.7% |
| Mean | 42.0% | 31.7% |
| Median | 39.2% | 29.4% |
| Interquartile 25% (IQ1) | 33.4% | 23.4% |
| Interquartile 75% (IQ3) | 46.3% | 34.4% |
| Interquartile Range (IQR) | 12.9% | 11.0% |
| Standard Deviation (Sample) | 19.8% | 15.8% |
| Standard Deviation (Population) | 19.5% | 15.7% |
Similar Demographics by In Labor Force | Age 16-19
Demographics Similar to Ukrainians by In Labor Force | Age 16-19
In terms of in labor force | age 16-19, the demographic groups most similar to Ukrainians are Assyrian/Chaldean/Syriac (38.3%, a difference of 0.090%), Immigrants from Nepal (38.3%, a difference of 0.10%), Chickasaw (38.3%, a difference of 0.11%), Ethiopian (38.2%, a difference of 0.11%), and Guamanian/Chamorro (38.2%, a difference of 0.13%).
| Demographics | Rating | Rank | In Labor Force | Age 16-19 |
| Sub-Saharan Africans | 98.3 /100 | #113 | Exceptional 38.4% |
| Hawaiians | 98.2 /100 | #114 | Exceptional 38.4% |
| Bulgarians | 97.9 /100 | #115 | Exceptional 38.3% |
| Colville | 97.9 /100 | #116 | Exceptional 38.3% |
| Chickasaw | 97.8 /100 | #117 | Exceptional 38.3% |
| Immigrants | Nepal | 97.8 /100 | #118 | Exceptional 38.3% |
| Assyrians/Chaldeans/Syriacs | 97.8 /100 | #119 | Exceptional 38.3% |
| Ukrainians | 97.6 /100 | #120 | Exceptional 38.3% |
| Ethiopians | 97.4 /100 | #121 | Exceptional 38.2% |
| Guamanians/Chamorros | 97.4 /100 | #122 | Exceptional 38.2% |
| Seminole | 96.7 /100 | #123 | Exceptional 38.1% |
| Immigrants | England | 96.4 /100 | #124 | Exceptional 38.1% |
| Immigrants | Africa | 96.1 /100 | #125 | Exceptional 38.0% |
| Africans | 95.6 /100 | #126 | Exceptional 38.0% |
| Choctaw | 95.6 /100 | #127 | Exceptional 38.0% |
Demographics Similar to Immigrants from Hong Kong by In Labor Force | Age 16-19
In terms of in labor force | age 16-19, the demographic groups most similar to Immigrants from Hong Kong are Immigrants from Israel (30.5%, a difference of 0.020%), Puerto Rican (30.3%, a difference of 0.42%), Immigrants from Cuba (30.2%, a difference of 0.75%), Immigrants from Trinidad and Tobago (30.2%, a difference of 1.0%), and Immigrants from Bangladesh (30.0%, a difference of 1.4%).
| Demographics | Rating | Rank | In Labor Force | Age 16-19 |
| Immigrants | Dominican Republic | 0.0 /100 | #326 | Tragic 31.1% |
| Immigrants | Taiwan | 0.0 /100 | #327 | Tragic 31.0% |
| Immigrants | Ecuador | 0.0 /100 | #328 | Tragic 31.0% |
| Barbadians | 0.0 /100 | #329 | Tragic 31.0% |
| Lumbee | 0.0 /100 | #330 | Tragic 31.0% |
| Trinidadians and Tobagonians | 0.0 /100 | #331 | Tragic 30.9% |
| Immigrants | Israel | 0.0 /100 | #332 | Tragic 30.5% |
| Immigrants | Hong Kong | 0.0 /100 | #333 | Tragic 30.5% |
| Puerto Ricans | 0.0 /100 | #334 | Tragic 30.3% |
| Immigrants | Cuba | 0.0 /100 | #335 | Tragic 30.2% |
| Immigrants | Trinidad and Tobago | 0.0 /100 | #336 | Tragic 30.2% |
| Immigrants | Bangladesh | 0.0 /100 | #337 | Tragic 30.0% |
| Vietnamese | 0.0 /100 | #338 | Tragic 29.6% |
| Immigrants | Uzbekistan | 0.0 /100 | #339 | Tragic 29.2% |
| British West Indians | 0.0 /100 | #340 | Tragic 29.1% |