Ukrainian vs Houma In Labor Force | Age 16-19
COMPARE
Ukrainian
Houma
In Labor Force | Age 16-19
In Labor Force | Age 16-19 Comparison
Ukrainians
Houma
38.3%
IN LABOR FORCE | AGE 16-19
97.6/ 100
METRIC RATING
120th/ 347
METRIC RANK
35.6%
IN LABOR FORCE | AGE 16-19
11.0/ 100
METRIC RATING
212th/ 347
METRIC RANK
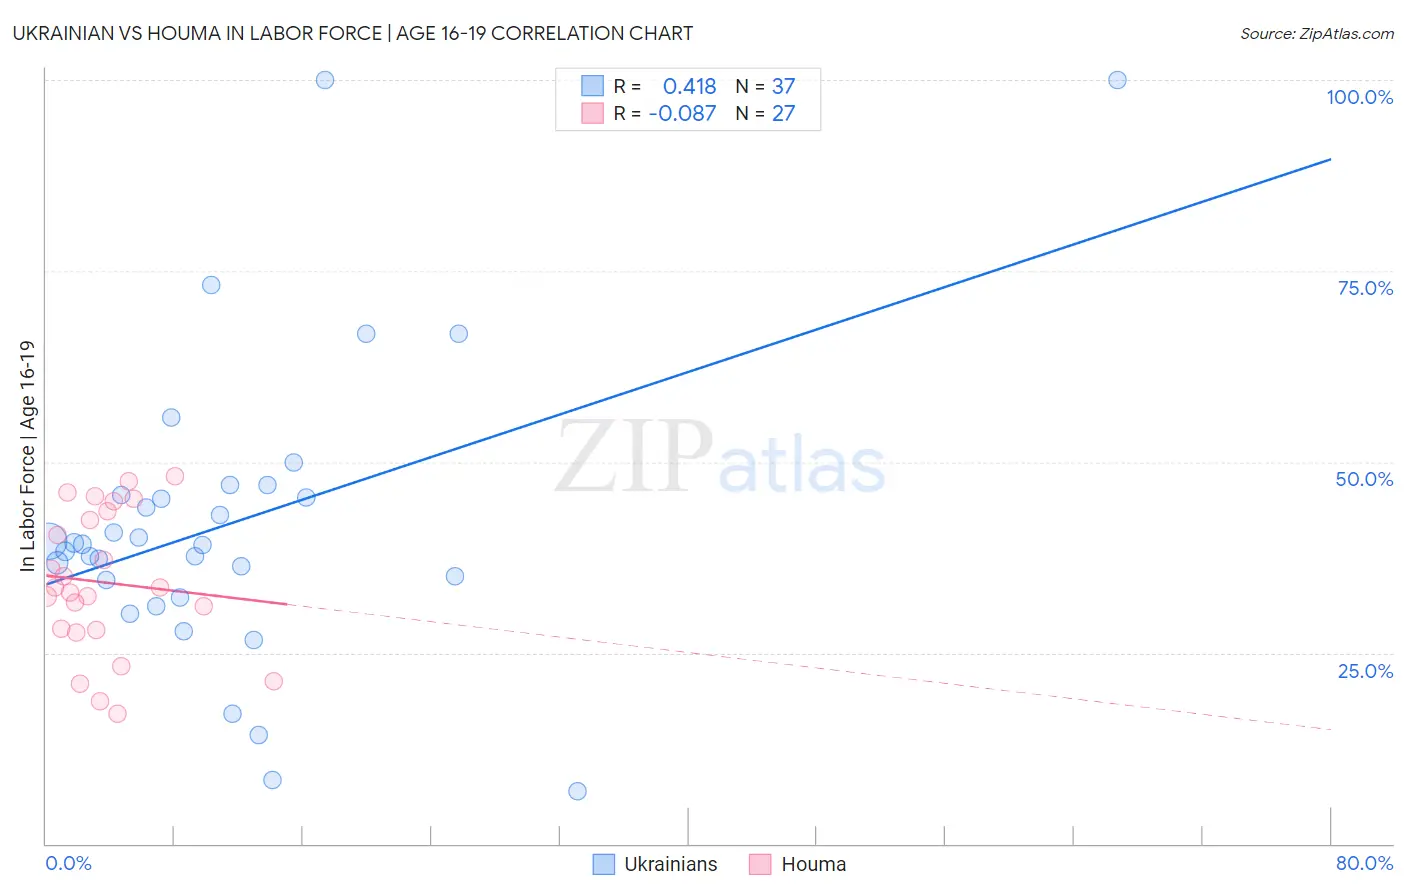
Ukrainian vs Houma In Labor Force | Age 16-19 Correlation Chart
The statistical analysis conducted on geographies consisting of 447,440,014 people shows a moderate positive correlation between the proportion of Ukrainians and labor force participation rate among population between the ages 16 and 19 in the United States with a correlation coefficient (R) of 0.418 and weighted average of 38.3%. Similarly, the statistical analysis conducted on geographies consisting of 36,777,014 people shows a slight negative correlation between the proportion of Houma and labor force participation rate among population between the ages 16 and 19 in the United States with a correlation coefficient (R) of -0.087 and weighted average of 35.6%, a difference of 7.5%.
In Labor Force | Age 16-19 Correlation Summary
| Measurement | Ukrainian | Houma |
| Minimum | 6.9% | 17.1% |
| Maximum | 100.0% | 48.1% |
| Range | 93.1% | 31.0% |
| Mean | 42.0% | 34.2% |
| Median | 39.2% | 33.5% |
| Interquartile 25% (IQ1) | 33.4% | 28.0% |
| Interquartile 75% (IQ3) | 46.3% | 43.6% |
| Interquartile Range (IQR) | 12.9% | 15.6% |
| Standard Deviation (Sample) | 19.8% | 9.2% |
| Standard Deviation (Population) | 19.5% | 9.1% |
Similar Demographics by In Labor Force | Age 16-19
Demographics Similar to Ukrainians by In Labor Force | Age 16-19
In terms of in labor force | age 16-19, the demographic groups most similar to Ukrainians are Assyrian/Chaldean/Syriac (38.3%, a difference of 0.090%), Immigrants from Nepal (38.3%, a difference of 0.10%), Chickasaw (38.3%, a difference of 0.11%), Ethiopian (38.2%, a difference of 0.11%), and Guamanian/Chamorro (38.2%, a difference of 0.13%).
| Demographics | Rating | Rank | In Labor Force | Age 16-19 |
| Sub-Saharan Africans | 98.3 /100 | #113 | Exceptional 38.4% |
| Hawaiians | 98.2 /100 | #114 | Exceptional 38.4% |
| Bulgarians | 97.9 /100 | #115 | Exceptional 38.3% |
| Colville | 97.9 /100 | #116 | Exceptional 38.3% |
| Chickasaw | 97.8 /100 | #117 | Exceptional 38.3% |
| Immigrants | Nepal | 97.8 /100 | #118 | Exceptional 38.3% |
| Assyrians/Chaldeans/Syriacs | 97.8 /100 | #119 | Exceptional 38.3% |
| Ukrainians | 97.6 /100 | #120 | Exceptional 38.3% |
| Ethiopians | 97.4 /100 | #121 | Exceptional 38.2% |
| Guamanians/Chamorros | 97.4 /100 | #122 | Exceptional 38.2% |
| Seminole | 96.7 /100 | #123 | Exceptional 38.1% |
| Immigrants | England | 96.4 /100 | #124 | Exceptional 38.1% |
| Immigrants | Africa | 96.1 /100 | #125 | Exceptional 38.0% |
| Africans | 95.6 /100 | #126 | Exceptional 38.0% |
| Choctaw | 95.6 /100 | #127 | Exceptional 38.0% |
Demographics Similar to Houma by In Labor Force | Age 16-19
In terms of in labor force | age 16-19, the demographic groups most similar to Houma are Immigrants from Bolivia (35.6%, a difference of 0.0%), Apache (35.6%, a difference of 0.010%), Immigrants from South Eastern Asia (35.6%, a difference of 0.030%), Dutch West Indian (35.6%, a difference of 0.050%), and Immigrants from Costa Rica (35.6%, a difference of 0.050%).
| Demographics | Rating | Rank | In Labor Force | Age 16-19 |
| South American Indians | 14.6 /100 | #205 | Poor 35.8% |
| Chileans | 14.6 /100 | #206 | Poor 35.8% |
| Immigrants | Eastern Europe | 14.5 /100 | #207 | Poor 35.8% |
| Koreans | 13.3 /100 | #208 | Poor 35.7% |
| Moroccans | 12.7 /100 | #209 | Poor 35.7% |
| Immigrants | Switzerland | 11.9 /100 | #210 | Poor 35.6% |
| Mexicans | 11.9 /100 | #211 | Poor 35.6% |
| Houma | 11.0 /100 | #212 | Poor 35.6% |
| Immigrants | Bolivia | 11.0 /100 | #213 | Poor 35.6% |
| Apache | 11.0 /100 | #214 | Poor 35.6% |
| Immigrants | South Eastern Asia | 10.8 /100 | #215 | Poor 35.6% |
| Dutch West Indians | 10.7 /100 | #216 | Poor 35.6% |
| Immigrants | Costa Rica | 10.7 /100 | #217 | Poor 35.6% |
| Sri Lankans | 9.8 /100 | #218 | Tragic 35.5% |
| Guatemalans | 8.6 /100 | #219 | Tragic 35.5% |