Ukrainian vs Finnish In Labor Force | Age 16-19
COMPARE
Ukrainian
Finnish
In Labor Force | Age 16-19
In Labor Force | Age 16-19 Comparison
Ukrainians
Finns
38.3%
IN LABOR FORCE | AGE 16-19
97.6/ 100
METRIC RATING
120th/ 347
METRIC RANK
43.9%
IN LABOR FORCE | AGE 16-19
100.0/ 100
METRIC RATING
12th/ 347
METRIC RANK
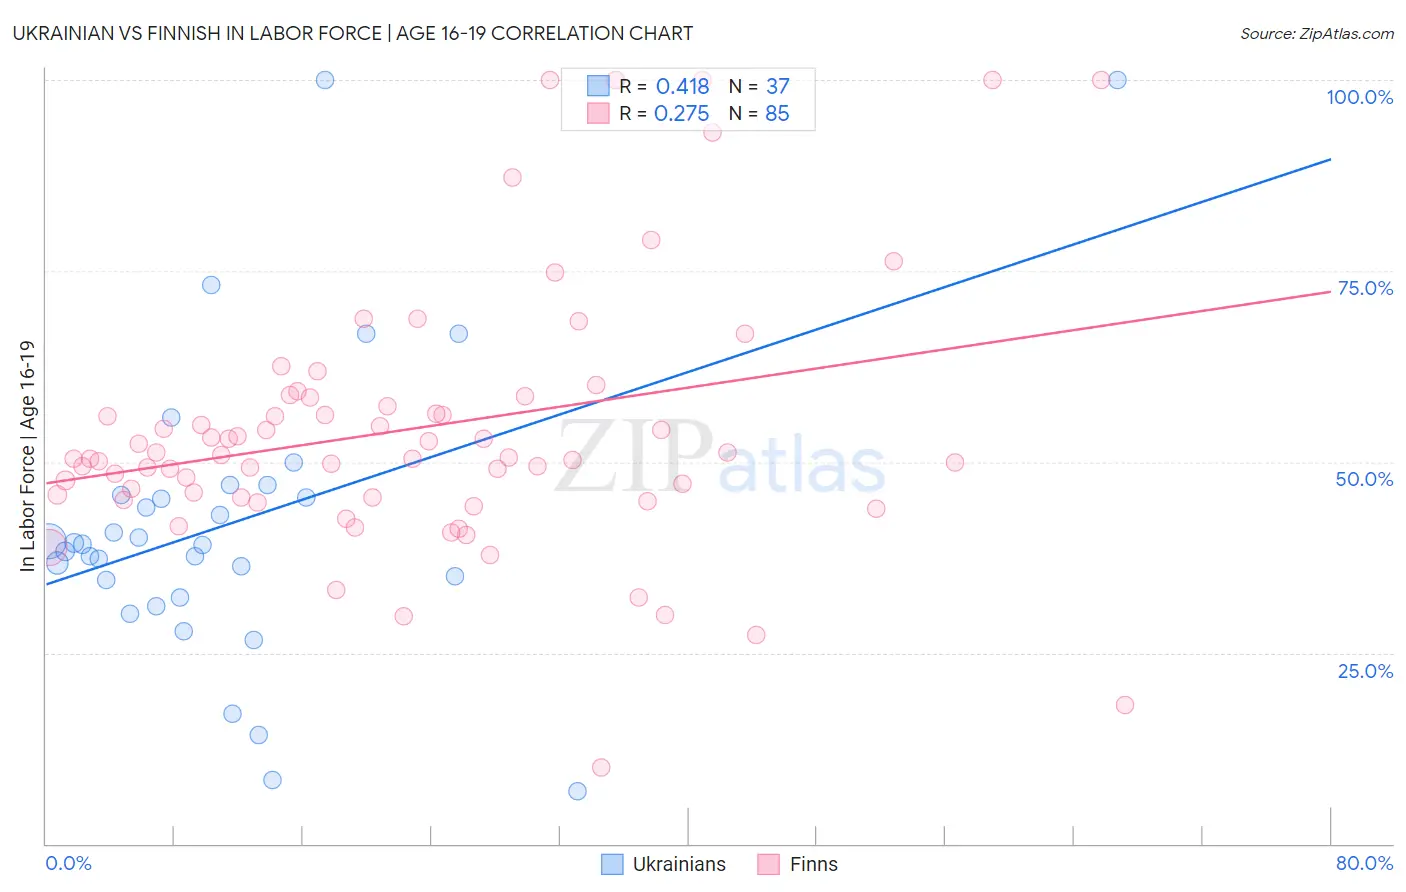
Ukrainian vs Finnish In Labor Force | Age 16-19 Correlation Chart
The statistical analysis conducted on geographies consisting of 447,440,014 people shows a moderate positive correlation between the proportion of Ukrainians and labor force participation rate among population between the ages 16 and 19 in the United States with a correlation coefficient (R) of 0.418 and weighted average of 38.3%. Similarly, the statistical analysis conducted on geographies consisting of 403,764,919 people shows a weak positive correlation between the proportion of Finns and labor force participation rate among population between the ages 16 and 19 in the United States with a correlation coefficient (R) of 0.275 and weighted average of 43.9%, a difference of 14.7%.
In Labor Force | Age 16-19 Correlation Summary
| Measurement | Ukrainian | Finnish |
| Minimum | 6.9% | 10.0% |
| Maximum | 100.0% | 100.0% |
| Range | 93.1% | 90.0% |
| Mean | 42.0% | 54.5% |
| Median | 39.2% | 50.6% |
| Interquartile 25% (IQ1) | 33.4% | 45.4% |
| Interquartile 75% (IQ3) | 46.3% | 58.5% |
| Interquartile Range (IQR) | 12.9% | 13.1% |
| Standard Deviation (Sample) | 19.8% | 17.8% |
| Standard Deviation (Population) | 19.5% | 17.7% |
Similar Demographics by In Labor Force | Age 16-19
Demographics Similar to Ukrainians by In Labor Force | Age 16-19
In terms of in labor force | age 16-19, the demographic groups most similar to Ukrainians are Assyrian/Chaldean/Syriac (38.3%, a difference of 0.090%), Immigrants from Nepal (38.3%, a difference of 0.10%), Chickasaw (38.3%, a difference of 0.11%), Ethiopian (38.2%, a difference of 0.11%), and Guamanian/Chamorro (38.2%, a difference of 0.13%).
| Demographics | Rating | Rank | In Labor Force | Age 16-19 |
| Sub-Saharan Africans | 98.3 /100 | #113 | Exceptional 38.4% |
| Hawaiians | 98.2 /100 | #114 | Exceptional 38.4% |
| Bulgarians | 97.9 /100 | #115 | Exceptional 38.3% |
| Colville | 97.9 /100 | #116 | Exceptional 38.3% |
| Chickasaw | 97.8 /100 | #117 | Exceptional 38.3% |
| Immigrants | Nepal | 97.8 /100 | #118 | Exceptional 38.3% |
| Assyrians/Chaldeans/Syriacs | 97.8 /100 | #119 | Exceptional 38.3% |
| Ukrainians | 97.6 /100 | #120 | Exceptional 38.3% |
| Ethiopians | 97.4 /100 | #121 | Exceptional 38.2% |
| Guamanians/Chamorros | 97.4 /100 | #122 | Exceptional 38.2% |
| Seminole | 96.7 /100 | #123 | Exceptional 38.1% |
| Immigrants | England | 96.4 /100 | #124 | Exceptional 38.1% |
| Immigrants | Africa | 96.1 /100 | #125 | Exceptional 38.0% |
| Africans | 95.6 /100 | #126 | Exceptional 38.0% |
| Choctaw | 95.6 /100 | #127 | Exceptional 38.0% |
Demographics Similar to Finns by In Labor Force | Age 16-19
In terms of in labor force | age 16-19, the demographic groups most similar to Finns are Dutch (43.8%, a difference of 0.19%), Chippewa (43.8%, a difference of 0.29%), Swedish (44.1%, a difference of 0.46%), German (44.2%, a difference of 0.54%), and Slovene (43.7%, a difference of 0.55%).
| Demographics | Rating | Rank | In Labor Force | Age 16-19 |
| Alaskan Athabascans | 100.0 /100 | #5 | Exceptional 45.2% |
| Somalis | 100.0 /100 | #6 | Exceptional 45.1% |
| Danes | 100.0 /100 | #7 | Exceptional 44.7% |
| Immigrants | Cabo Verde | 100.0 /100 | #8 | Exceptional 44.7% |
| Cape Verdeans | 100.0 /100 | #9 | Exceptional 44.5% |
| Germans | 100.0 /100 | #10 | Exceptional 44.2% |
| Swedes | 100.0 /100 | #11 | Exceptional 44.1% |
| Finns | 100.0 /100 | #12 | Exceptional 43.9% |
| Dutch | 100.0 /100 | #13 | Exceptional 43.8% |
| Chippewa | 100.0 /100 | #14 | Exceptional 43.8% |
| Slovenes | 100.0 /100 | #15 | Exceptional 43.7% |
| Czechs | 100.0 /100 | #16 | Exceptional 43.6% |
| Scandinavians | 100.0 /100 | #17 | Exceptional 43.6% |
| French Canadians | 100.0 /100 | #18 | Exceptional 43.6% |
| Belgians | 100.0 /100 | #19 | Exceptional 43.4% |