Filipino vs Cheyenne In Labor Force | Age 16-19
COMPARE
Filipino
Cheyenne
In Labor Force | Age 16-19
In Labor Force | Age 16-19 Comparison
Filipinos
Cheyenne
31.7%
IN LABOR FORCE | AGE 16-19
0.0/ 100
METRIC RATING
316th/ 347
METRIC RANK
37.9%
IN LABOR FORCE | AGE 16-19
94.6/ 100
METRIC RATING
133rd/ 347
METRIC RANK
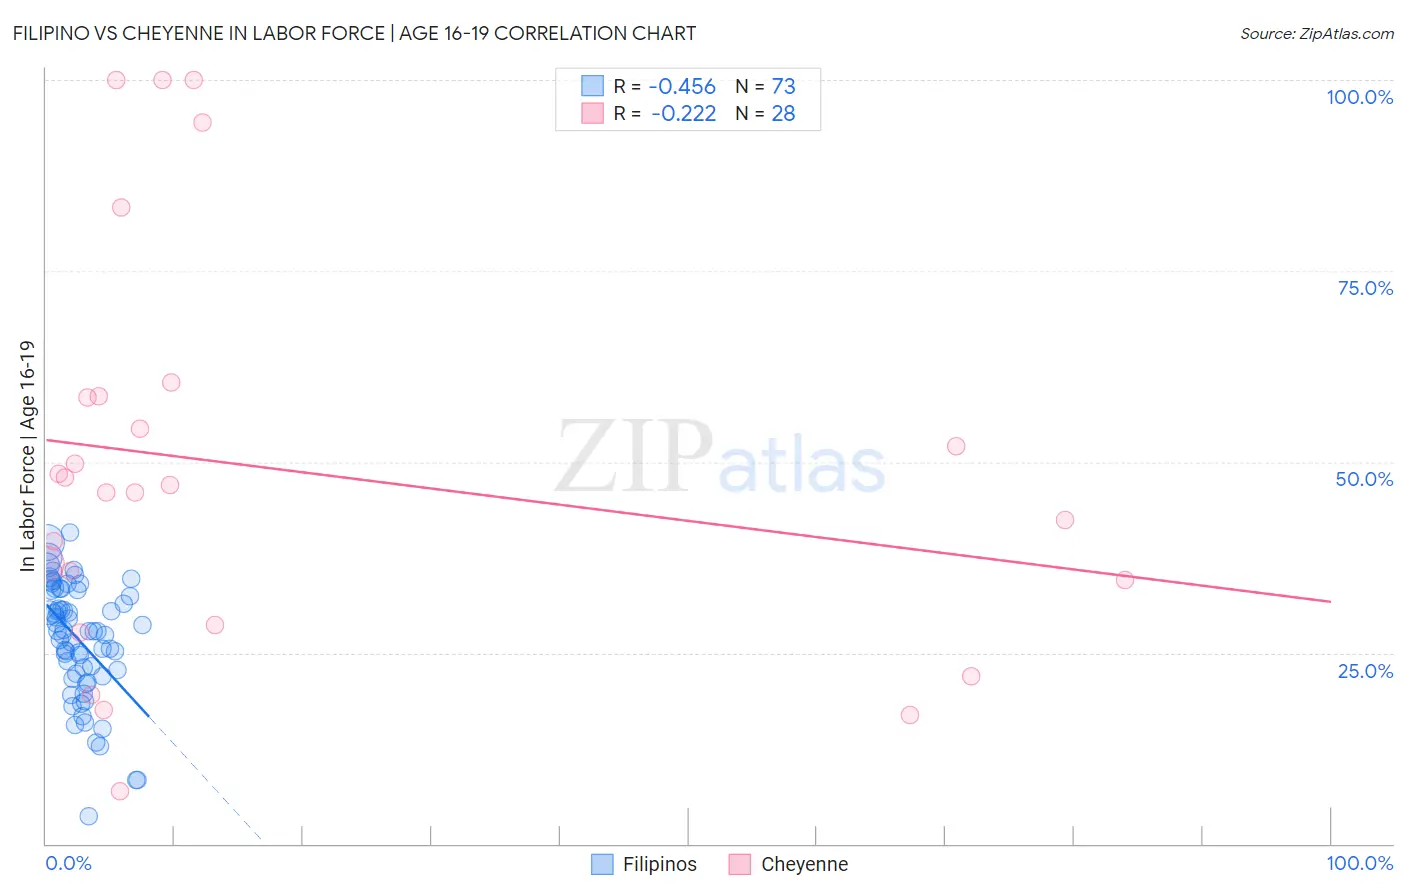
Filipino vs Cheyenne In Labor Force | Age 16-19 Correlation Chart
The statistical analysis conducted on geographies consisting of 254,095,508 people shows a moderate negative correlation between the proportion of Filipinos and labor force participation rate among population between the ages 16 and 19 in the United States with a correlation coefficient (R) of -0.456 and weighted average of 31.7%. Similarly, the statistical analysis conducted on geographies consisting of 80,651,378 people shows a weak negative correlation between the proportion of Cheyenne and labor force participation rate among population between the ages 16 and 19 in the United States with a correlation coefficient (R) of -0.222 and weighted average of 37.9%, a difference of 19.6%.
In Labor Force | Age 16-19 Correlation Summary
| Measurement | Filipino | Cheyenne |
| Minimum | 3.5% | 6.9% |
| Maximum | 40.8% | 100.0% |
| Range | 37.3% | 93.1% |
| Mean | 26.6% | 49.1% |
| Median | 27.8% | 46.5% |
| Interquartile 25% (IQ1) | 22.1% | 31.6% |
| Interquartile 75% (IQ3) | 33.2% | 58.6% |
| Interquartile Range (IQR) | 11.1% | 27.0% |
| Standard Deviation (Sample) | 7.7% | 26.1% |
| Standard Deviation (Population) | 7.6% | 25.6% |
Similar Demographics by In Labor Force | Age 16-19
Demographics Similar to Filipinos by In Labor Force | Age 16-19
In terms of in labor force | age 16-19, the demographic groups most similar to Filipinos are Immigrants from West Indies (31.7%, a difference of 0.080%), Immigrants from Nicaragua (31.6%, a difference of 0.19%), Cuban (31.8%, a difference of 0.26%), Hopi (31.8%, a difference of 0.42%), and Immigrants from Belize (31.8%, a difference of 0.43%).
| Demographics | Rating | Rank | In Labor Force | Age 16-19 |
| Immigrants | Eastern Asia | 0.0 /100 | #309 | Tragic 32.0% |
| Immigrants | Iran | 0.0 /100 | #310 | Tragic 32.0% |
| Indians (Asian) | 0.0 /100 | #311 | Tragic 31.9% |
| Immigrants | Belize | 0.0 /100 | #312 | Tragic 31.8% |
| Hopi | 0.0 /100 | #313 | Tragic 31.8% |
| Cubans | 0.0 /100 | #314 | Tragic 31.8% |
| Immigrants | West Indies | 0.0 /100 | #315 | Tragic 31.7% |
| Filipinos | 0.0 /100 | #316 | Tragic 31.7% |
| Immigrants | Nicaragua | 0.0 /100 | #317 | Tragic 31.6% |
| Immigrants | Yemen | 0.0 /100 | #318 | Tragic 31.5% |
| Soviet Union | 0.0 /100 | #319 | Tragic 31.4% |
| Ecuadorians | 0.0 /100 | #320 | Tragic 31.4% |
| West Indians | 0.0 /100 | #321 | Tragic 31.3% |
| Tohono O'odham | 0.0 /100 | #322 | Tragic 31.3% |
| Immigrants | Caribbean | 0.0 /100 | #323 | Tragic 31.2% |
Demographics Similar to Cheyenne by In Labor Force | Age 16-19
In terms of in labor force | age 16-19, the demographic groups most similar to Cheyenne are Immigrants from Oceania (37.9%, a difference of 0.020%), Immigrants from Austria (37.9%, a difference of 0.11%), Immigrants from Zimbabwe (38.0%, a difference of 0.20%), Immigrants from Netherlands (37.8%, a difference of 0.21%), and Spaniard (38.0%, a difference of 0.23%).
| Demographics | Rating | Rank | In Labor Force | Age 16-19 |
| Africans | 95.6 /100 | #126 | Exceptional 38.0% |
| Choctaw | 95.6 /100 | #127 | Exceptional 38.0% |
| New Zealanders | 95.6 /100 | #128 | Exceptional 38.0% |
| Spaniards | 95.5 /100 | #129 | Exceptional 38.0% |
| Immigrants | Zimbabwe | 95.4 /100 | #130 | Exceptional 38.0% |
| Immigrants | Austria | 95.0 /100 | #131 | Exceptional 37.9% |
| Immigrants | Oceania | 94.7 /100 | #132 | Exceptional 37.9% |
| Cheyenne | 94.6 /100 | #133 | Exceptional 37.9% |
| Immigrants | Netherlands | 93.7 /100 | #134 | Exceptional 37.8% |
| Macedonians | 93.4 /100 | #135 | Exceptional 37.8% |
| Australians | 93.2 /100 | #136 | Exceptional 37.8% |
| Cajuns | 93.2 /100 | #137 | Exceptional 37.8% |
| Comanche | 91.9 /100 | #138 | Exceptional 37.7% |
| Immigrants | Moldova | 91.9 /100 | #139 | Exceptional 37.7% |
| Estonians | 91.7 /100 | #140 | Exceptional 37.7% |