Ugandan vs Immigrants from Asia 12th Grade, No Diploma
COMPARE
Ugandan
Immigrants from Asia
12th Grade, No Diploma
12th Grade, No Diploma Comparison
Ugandans
Immigrants from Asia
91.5%
12TH GRADE, NO DIPLOMA
79.0/ 100
METRIC RATING
149th/ 347
METRIC RANK
91.3%
12TH GRADE, NO DIPLOMA
61.5/ 100
METRIC RATING
163rd/ 347
METRIC RANK
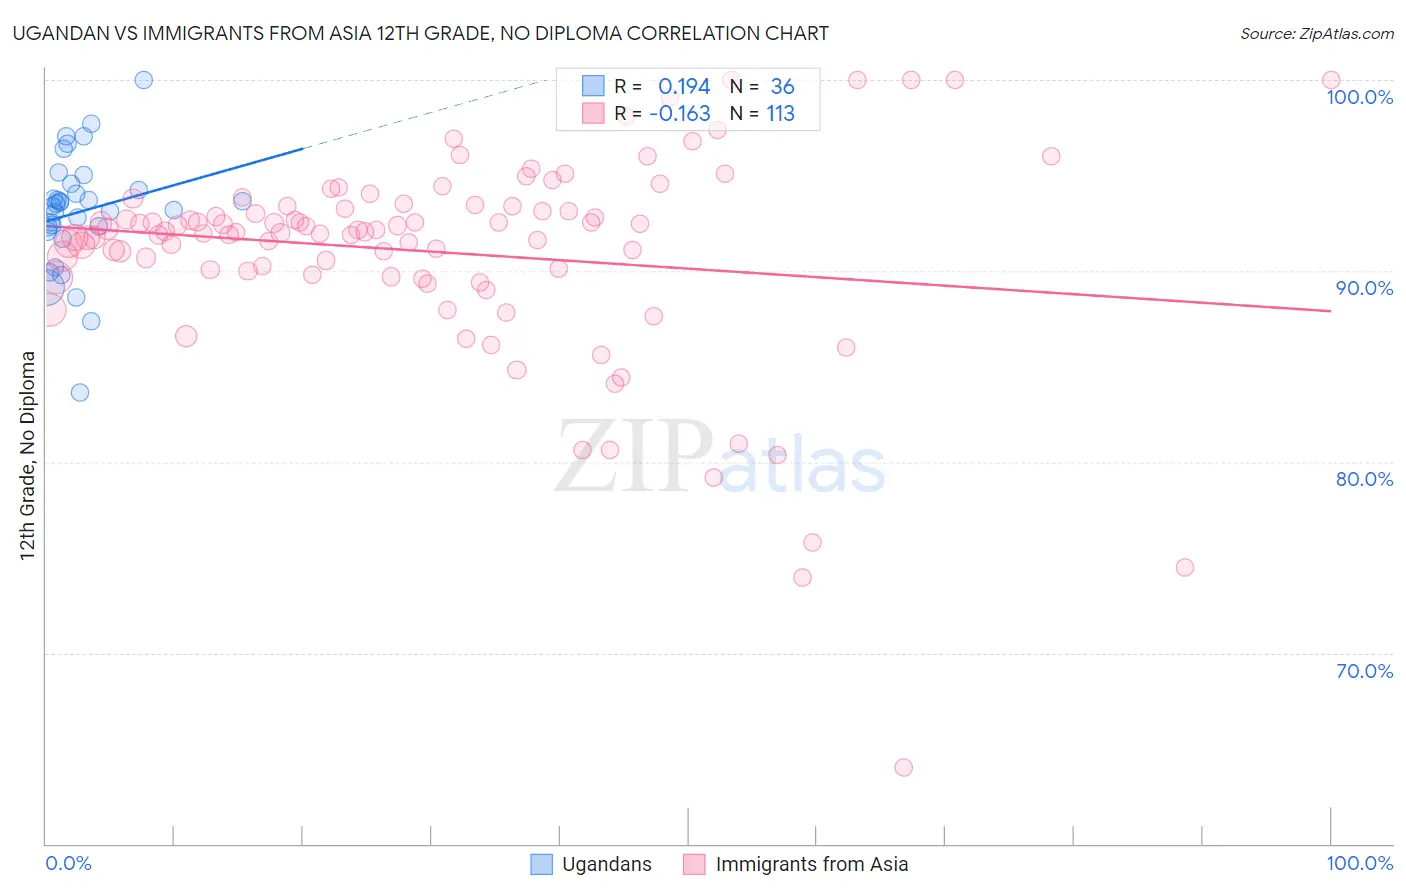
Ugandan vs Immigrants from Asia 12th Grade, No Diploma Correlation Chart
The statistical analysis conducted on geographies consisting of 93,991,892 people shows a poor positive correlation between the proportion of Ugandans and percentage of population with at least 12th grade (no diploma) education in the United States with a correlation coefficient (R) of 0.194 and weighted average of 91.5%. Similarly, the statistical analysis conducted on geographies consisting of 549,170,397 people shows a poor negative correlation between the proportion of Immigrants from Asia and percentage of population with at least 12th grade (no diploma) education in the United States with a correlation coefficient (R) of -0.163 and weighted average of 91.3%, a difference of 0.26%.
12th Grade, No Diploma Correlation Summary
| Measurement | Ugandan | Immigrants from Asia |
| Minimum | 83.7% | 64.0% |
| Maximum | 100.0% | 100.0% |
| Range | 16.3% | 36.0% |
| Mean | 93.1% | 91.0% |
| Median | 93.5% | 92.1% |
| Interquartile 25% (IQ1) | 92.2% | 89.9% |
| Interquartile 75% (IQ3) | 94.4% | 93.4% |
| Interquartile Range (IQR) | 2.2% | 3.5% |
| Standard Deviation (Sample) | 3.1% | 5.5% |
| Standard Deviation (Population) | 3.0% | 5.5% |
Demographics Similar to Ugandans and Immigrants from Asia by 12th Grade, No Diploma
In terms of 12th grade, no diploma, the demographic groups most similar to Ugandans are Paraguayan (91.5%, a difference of 0.0%), Chippewa (91.5%, a difference of 0.0%), Immigrants from Brazil (91.5%, a difference of 0.010%), Pakistani (91.5%, a difference of 0.010%), and Indian (Asian) (91.5%, a difference of 0.010%). Similarly, the demographic groups most similar to Immigrants from Asia are Brazilian (91.3%, a difference of 0.010%), Immigrants from China (91.3%, a difference of 0.010%), Immigrants from Albania (91.3%, a difference of 0.030%), Immigrants from Hong Kong (91.3%, a difference of 0.030%), and Laotian (91.3%, a difference of 0.040%).
| Demographics | Rating | Rank | 12th Grade, No Diploma |
| Immigrants | Brazil | 79.8 /100 | #146 | Good 91.5% |
| Pakistanis | 79.6 /100 | #147 | Good 91.5% |
| Indians (Asian) | 79.4 /100 | #148 | Good 91.5% |
| Ugandans | 79.0 /100 | #149 | Good 91.5% |
| Paraguayans | 78.9 /100 | #150 | Good 91.5% |
| Chippewa | 78.8 /100 | #151 | Good 91.5% |
| Kenyans | 77.4 /100 | #152 | Good 91.5% |
| Iraqis | 75.3 /100 | #153 | Good 91.5% |
| Immigrants | Kenya | 73.9 /100 | #154 | Good 91.5% |
| Immigrants | Iraq | 73.0 /100 | #155 | Good 91.4% |
| Asians | 71.9 /100 | #156 | Good 91.4% |
| Immigrants | Pakistan | 70.7 /100 | #157 | Good 91.4% |
| Immigrants | Northern Africa | 66.2 /100 | #158 | Good 91.4% |
| Laotians | 64.4 /100 | #159 | Good 91.3% |
| Immigrants | Albania | 64.1 /100 | #160 | Good 91.3% |
| Immigrants | Hong Kong | 63.8 /100 | #161 | Good 91.3% |
| Brazilians | 62.0 /100 | #162 | Good 91.3% |
| Immigrants | Asia | 61.5 /100 | #163 | Good 91.3% |
| Immigrants | China | 60.9 /100 | #164 | Good 91.3% |
| Alsatians | 58.3 /100 | #165 | Average 91.3% |
| Hmong | 58.0 /100 | #166 | Average 91.3% |