Ugandan vs Czech In Labor Force | Age > 16
COMPARE
Ugandan
Czech
In Labor Force | Age > 16
In Labor Force | Age > 16 Comparison
Ugandans
Czechs
67.4%
IN LABOR FORCE | AGE > 16
100.0/ 100
METRIC RATING
24th/ 347
METRIC RANK
65.4%
IN LABOR FORCE | AGE > 16
81.5/ 100
METRIC RATING
151st/ 347
METRIC RANK
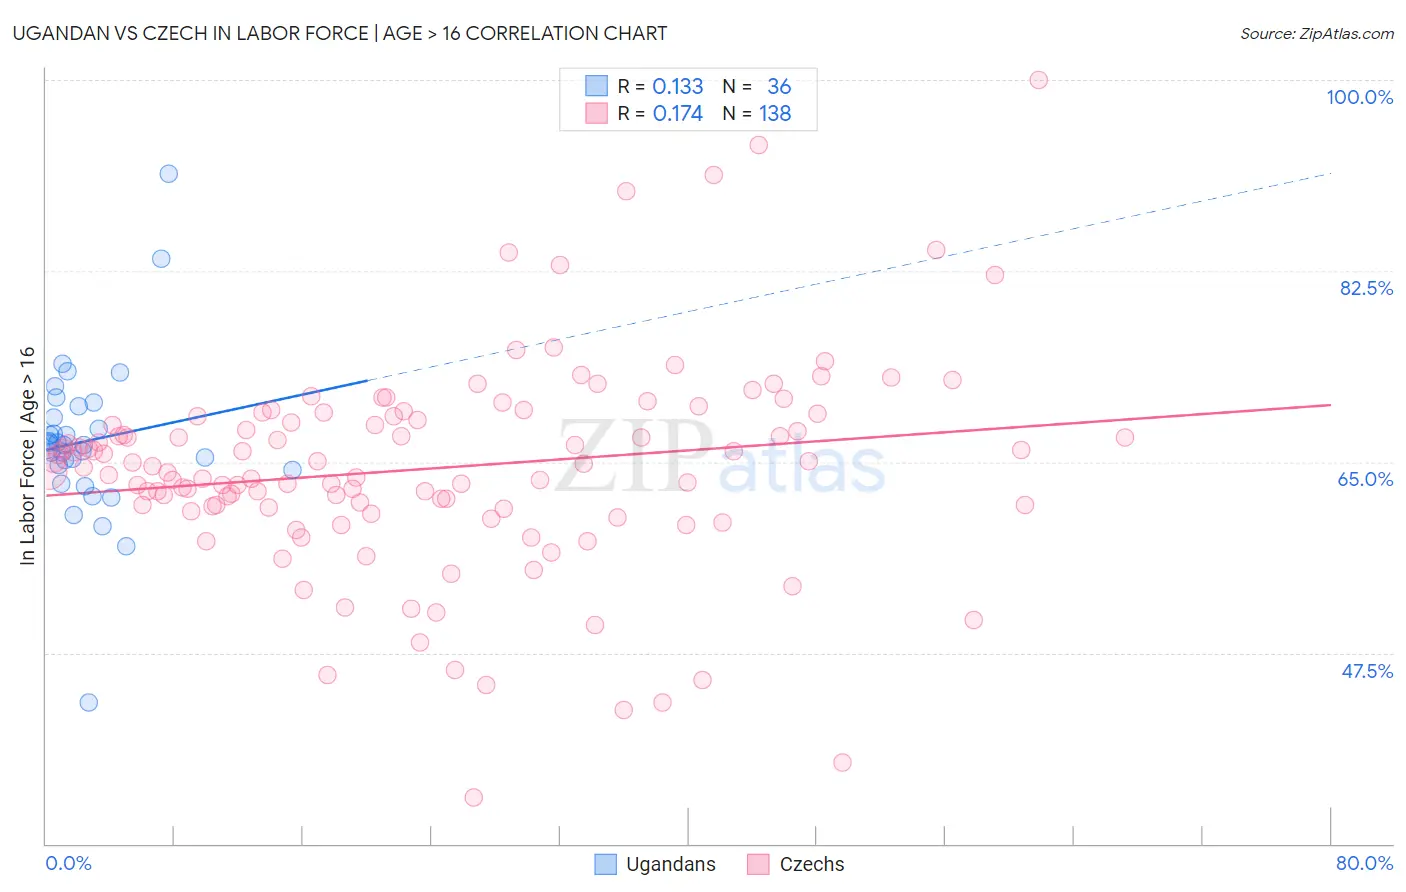
Ugandan vs Czech In Labor Force | Age > 16 Correlation Chart
The statistical analysis conducted on geographies consisting of 94,018,069 people shows a poor positive correlation between the proportion of Ugandans and labor force participation rate among population ages 16 and over in the United States with a correlation coefficient (R) of 0.133 and weighted average of 67.4%. Similarly, the statistical analysis conducted on geographies consisting of 484,823,613 people shows a poor positive correlation between the proportion of Czechs and labor force participation rate among population ages 16 and over in the United States with a correlation coefficient (R) of 0.174 and weighted average of 65.4%, a difference of 3.0%.
In Labor Force | Age > 16 Correlation Summary
| Measurement | Ugandan | Czech |
| Minimum | 42.9% | 34.2% |
| Maximum | 91.4% | 100.0% |
| Range | 48.5% | 65.8% |
| Mean | 66.9% | 64.4% |
| Median | 66.5% | 64.6% |
| Interquartile 25% (IQ1) | 64.5% | 60.8% |
| Interquartile 75% (IQ3) | 69.6% | 69.1% |
| Interquartile Range (IQR) | 5.1% | 8.3% |
| Standard Deviation (Sample) | 7.5% | 9.7% |
| Standard Deviation (Population) | 7.4% | 9.7% |
Similar Demographics by In Labor Force | Age > 16
Demographics Similar to Ugandans by In Labor Force | Age > 16
In terms of in labor force | age > 16, the demographic groups most similar to Ugandans are Immigrants from Africa (67.4%, a difference of 0.030%), Immigrants from Cabo Verde (67.3%, a difference of 0.050%), Cambodian (67.4%, a difference of 0.060%), Zimbabwean (67.3%, a difference of 0.13%), and Immigrants from Uganda (67.5%, a difference of 0.18%).
| Demographics | Rating | Rank | In Labor Force | Age > 16 |
| Immigrants | India | 100.0 /100 | #17 | Exceptional 67.6% |
| Immigrants | Liberia | 100.0 /100 | #18 | Exceptional 67.6% |
| Kenyans | 100.0 /100 | #19 | Exceptional 67.6% |
| Immigrants | Kenya | 100.0 /100 | #20 | Exceptional 67.6% |
| Tongans | 100.0 /100 | #21 | Exceptional 67.5% |
| Immigrants | Uganda | 100.0 /100 | #22 | Exceptional 67.5% |
| Cambodians | 100.0 /100 | #23 | Exceptional 67.4% |
| Ugandans | 100.0 /100 | #24 | Exceptional 67.4% |
| Immigrants | Africa | 100.0 /100 | #25 | Exceptional 67.4% |
| Immigrants | Cabo Verde | 100.0 /100 | #26 | Exceptional 67.3% |
| Zimbabweans | 100.0 /100 | #27 | Exceptional 67.3% |
| Immigrants | Morocco | 100.0 /100 | #28 | Exceptional 67.2% |
| Thais | 100.0 /100 | #29 | Exceptional 67.2% |
| Immigrants | Zaire | 100.0 /100 | #30 | Exceptional 67.2% |
| Ghanaians | 100.0 /100 | #31 | Exceptional 67.1% |
Demographics Similar to Czechs by In Labor Force | Age > 16
In terms of in labor force | age > 16, the demographic groups most similar to Czechs are Yugoslavian (65.4%, a difference of 0.0%), Immigrants (65.4%, a difference of 0.010%), Immigrants from China (65.4%, a difference of 0.020%), Immigrants from Eastern Europe (65.4%, a difference of 0.060%), and Immigrants from Armenia (65.3%, a difference of 0.080%).
| Demographics | Rating | Rank | In Labor Force | Age > 16 |
| Immigrants | Romania | 88.6 /100 | #144 | Excellent 65.5% |
| Tlingit-Haida | 88.3 /100 | #145 | Excellent 65.5% |
| Cypriots | 88.2 /100 | #146 | Excellent 65.5% |
| Immigrants | Oceania | 87.5 /100 | #147 | Excellent 65.5% |
| Bhutanese | 86.3 /100 | #148 | Excellent 65.5% |
| Immigrants | Albania | 85.7 /100 | #149 | Excellent 65.4% |
| Immigrants | Immigrants | 81.9 /100 | #150 | Excellent 65.4% |
| Czechs | 81.5 /100 | #151 | Excellent 65.4% |
| Yugoslavians | 81.3 /100 | #152 | Excellent 65.4% |
| Immigrants | China | 80.5 /100 | #153 | Excellent 65.4% |
| Immigrants | Eastern Europe | 78.3 /100 | #154 | Good 65.4% |
| Immigrants | Armenia | 76.6 /100 | #155 | Good 65.3% |
| Immigrants | Ireland | 75.9 /100 | #156 | Good 65.3% |
| Immigrants | Russia | 75.7 /100 | #157 | Good 65.3% |
| Panamanians | 75.2 /100 | #158 | Good 65.3% |