Ugandan vs Somali In Labor Force | Age > 16
COMPARE
Ugandan
Somali
In Labor Force | Age > 16
In Labor Force | Age > 16 Comparison
Ugandans
Somalis
67.4%
IN LABOR FORCE | AGE > 16
100.0/ 100
METRIC RATING
24th/ 347
METRIC RANK
69.2%
IN LABOR FORCE | AGE > 16
100.0/ 100
METRIC RATING
3rd/ 347
METRIC RANK
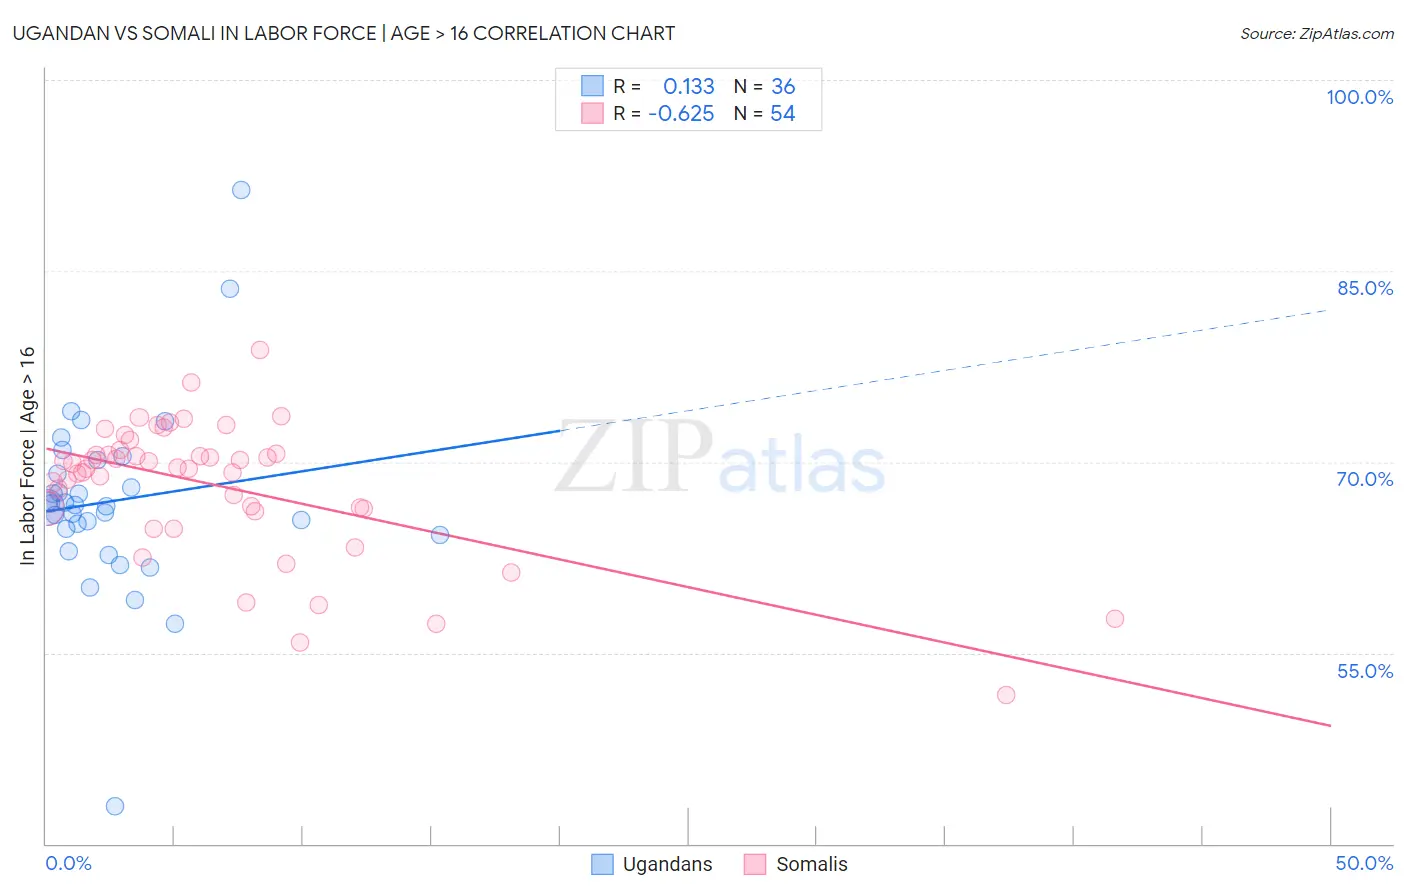
Ugandan vs Somali In Labor Force | Age > 16 Correlation Chart
The statistical analysis conducted on geographies consisting of 94,018,069 people shows a poor positive correlation between the proportion of Ugandans and labor force participation rate among population ages 16 and over in the United States with a correlation coefficient (R) of 0.133 and weighted average of 67.4%. Similarly, the statistical analysis conducted on geographies consisting of 99,331,399 people shows a significant negative correlation between the proportion of Somalis and labor force participation rate among population ages 16 and over in the United States with a correlation coefficient (R) of -0.625 and weighted average of 69.2%, a difference of 2.6%.
In Labor Force | Age > 16 Correlation Summary
| Measurement | Ugandan | Somali |
| Minimum | 42.9% | 51.7% |
| Maximum | 91.4% | 78.8% |
| Range | 48.5% | 27.1% |
| Mean | 66.9% | 68.1% |
| Median | 66.5% | 69.5% |
| Interquartile 25% (IQ1) | 64.5% | 66.3% |
| Interquartile 75% (IQ3) | 69.6% | 70.6% |
| Interquartile Range (IQR) | 5.1% | 4.3% |
| Standard Deviation (Sample) | 7.5% | 5.3% |
| Standard Deviation (Population) | 7.4% | 5.2% |
Similar Demographics by In Labor Force | Age > 16
Demographics Similar to Ugandans by In Labor Force | Age > 16
In terms of in labor force | age > 16, the demographic groups most similar to Ugandans are Immigrants from Africa (67.4%, a difference of 0.030%), Immigrants from Cabo Verde (67.3%, a difference of 0.050%), Cambodian (67.4%, a difference of 0.060%), Zimbabwean (67.3%, a difference of 0.13%), and Immigrants from Uganda (67.5%, a difference of 0.18%).
| Demographics | Rating | Rank | In Labor Force | Age > 16 |
| Immigrants | India | 100.0 /100 | #17 | Exceptional 67.6% |
| Immigrants | Liberia | 100.0 /100 | #18 | Exceptional 67.6% |
| Kenyans | 100.0 /100 | #19 | Exceptional 67.6% |
| Immigrants | Kenya | 100.0 /100 | #20 | Exceptional 67.6% |
| Tongans | 100.0 /100 | #21 | Exceptional 67.5% |
| Immigrants | Uganda | 100.0 /100 | #22 | Exceptional 67.5% |
| Cambodians | 100.0 /100 | #23 | Exceptional 67.4% |
| Ugandans | 100.0 /100 | #24 | Exceptional 67.4% |
| Immigrants | Africa | 100.0 /100 | #25 | Exceptional 67.4% |
| Immigrants | Cabo Verde | 100.0 /100 | #26 | Exceptional 67.3% |
| Zimbabweans | 100.0 /100 | #27 | Exceptional 67.3% |
| Immigrants | Morocco | 100.0 /100 | #28 | Exceptional 67.2% |
| Thais | 100.0 /100 | #29 | Exceptional 67.2% |
| Immigrants | Zaire | 100.0 /100 | #30 | Exceptional 67.2% |
| Ghanaians | 100.0 /100 | #31 | Exceptional 67.1% |
Demographics Similar to Somalis by In Labor Force | Age > 16
In terms of in labor force | age > 16, the demographic groups most similar to Somalis are Immigrants from Somalia (69.1%, a difference of 0.070%), Ethiopian (69.3%, a difference of 0.20%), Immigrants from Ethiopia (69.4%, a difference of 0.36%), Sierra Leonean (68.9%, a difference of 0.38%), and Immigrants from Eritrea (68.9%, a difference of 0.43%).
| Demographics | Rating | Rank | In Labor Force | Age > 16 |
| Immigrants | Ethiopia | 100.0 /100 | #1 | Exceptional 69.4% |
| Ethiopians | 100.0 /100 | #2 | Exceptional 69.3% |
| Somalis | 100.0 /100 | #3 | Exceptional 69.2% |
| Immigrants | Somalia | 100.0 /100 | #4 | Exceptional 69.1% |
| Sierra Leoneans | 100.0 /100 | #5 | Exceptional 68.9% |
| Immigrants | Eritrea | 100.0 /100 | #6 | Exceptional 68.9% |
| Immigrants | Cameroon | 100.0 /100 | #7 | Exceptional 68.7% |
| Immigrants | Sierra Leone | 100.0 /100 | #8 | Exceptional 68.5% |
| Immigrants | Eastern Africa | 100.0 /100 | #9 | Exceptional 68.5% |
| Immigrants | Bolivia | 100.0 /100 | #10 | Exceptional 68.4% |
| Bolivians | 100.0 /100 | #11 | Exceptional 68.2% |
| Sudanese | 100.0 /100 | #12 | Exceptional 68.0% |
| Immigrants | Nepal | 100.0 /100 | #13 | Exceptional 68.0% |
| Liberians | 100.0 /100 | #14 | Exceptional 67.8% |
| Immigrants | Middle Africa | 100.0 /100 | #15 | Exceptional 67.7% |