Egyptian vs Czech In Labor Force | Age > 16
COMPARE
Egyptian
Czech
In Labor Force | Age > 16
In Labor Force | Age > 16 Comparison
Egyptians
Czechs
66.2%
IN LABOR FORCE | AGE > 16
99.8/ 100
METRIC RATING
67th/ 347
METRIC RANK
65.4%
IN LABOR FORCE | AGE > 16
81.5/ 100
METRIC RATING
151st/ 347
METRIC RANK
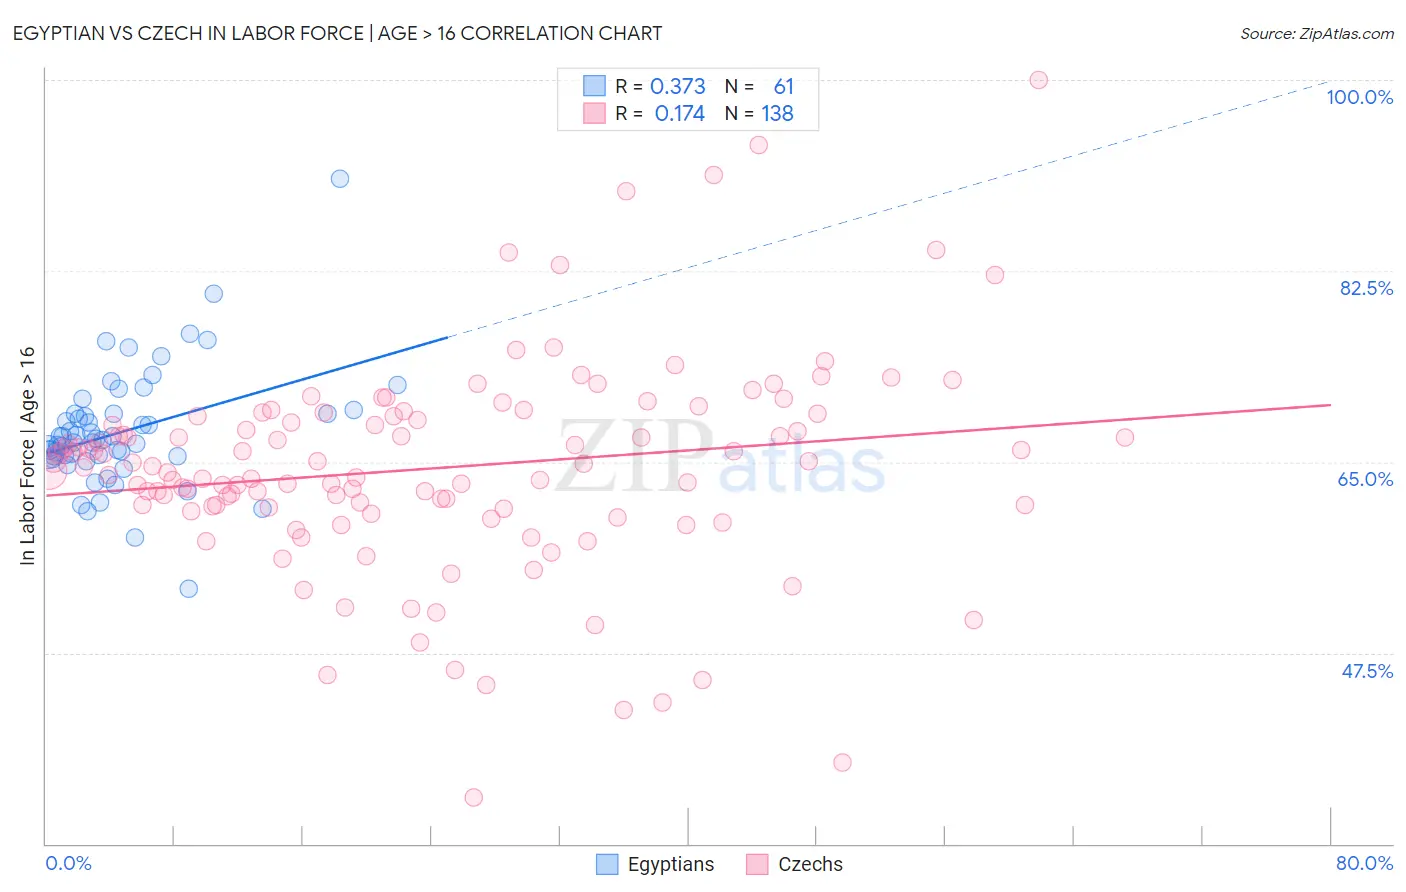
Egyptian vs Czech In Labor Force | Age > 16 Correlation Chart
The statistical analysis conducted on geographies consisting of 276,931,154 people shows a mild positive correlation between the proportion of Egyptians and labor force participation rate among population ages 16 and over in the United States with a correlation coefficient (R) of 0.373 and weighted average of 66.2%. Similarly, the statistical analysis conducted on geographies consisting of 484,823,613 people shows a poor positive correlation between the proportion of Czechs and labor force participation rate among population ages 16 and over in the United States with a correlation coefficient (R) of 0.174 and weighted average of 65.4%, a difference of 1.3%.
In Labor Force | Age > 16 Correlation Summary
| Measurement | Egyptian | Czech |
| Minimum | 53.4% | 34.2% |
| Maximum | 90.9% | 100.0% |
| Range | 37.5% | 65.8% |
| Mean | 67.8% | 64.4% |
| Median | 66.9% | 64.6% |
| Interquartile 25% (IQ1) | 65.5% | 60.8% |
| Interquartile 75% (IQ3) | 69.4% | 69.1% |
| Interquartile Range (IQR) | 3.9% | 8.3% |
| Standard Deviation (Sample) | 5.5% | 9.7% |
| Standard Deviation (Population) | 5.5% | 9.7% |
Similar Demographics by In Labor Force | Age > 16
Demographics Similar to Egyptians by In Labor Force | Age > 16
In terms of in labor force | age > 16, the demographic groups most similar to Egyptians are Jordanian (66.3%, a difference of 0.020%), Sri Lankan (66.3%, a difference of 0.050%), Immigrants from Egypt (66.2%, a difference of 0.050%), Subsaharan African (66.2%, a difference of 0.050%), and Venezuelan (66.3%, a difference of 0.060%).
| Demographics | Rating | Rank | In Labor Force | Age > 16 |
| Immigrants | Peru | 99.8 /100 | #60 | Exceptional 66.3% |
| Immigrants | Burma/Myanmar | 99.8 /100 | #61 | Exceptional 66.3% |
| Indonesians | 99.8 /100 | #62 | Exceptional 66.3% |
| Venezuelans | 99.8 /100 | #63 | Exceptional 66.3% |
| Peruvians | 99.8 /100 | #64 | Exceptional 66.3% |
| Sri Lankans | 99.8 /100 | #65 | Exceptional 66.3% |
| Jordanians | 99.8 /100 | #66 | Exceptional 66.3% |
| Egyptians | 99.8 /100 | #67 | Exceptional 66.2% |
| Immigrants | Egypt | 99.7 /100 | #68 | Exceptional 66.2% |
| Sub-Saharan Africans | 99.7 /100 | #69 | Exceptional 66.2% |
| Asians | 99.7 /100 | #70 | Exceptional 66.2% |
| Burmese | 99.7 /100 | #71 | Exceptional 66.2% |
| Taiwanese | 99.7 /100 | #72 | Exceptional 66.2% |
| Immigrants | Vietnam | 99.7 /100 | #73 | Exceptional 66.2% |
| Immigrants | Korea | 99.7 /100 | #74 | Exceptional 66.2% |
Demographics Similar to Czechs by In Labor Force | Age > 16
In terms of in labor force | age > 16, the demographic groups most similar to Czechs are Yugoslavian (65.4%, a difference of 0.0%), Immigrants (65.4%, a difference of 0.010%), Immigrants from China (65.4%, a difference of 0.020%), Immigrants from Eastern Europe (65.4%, a difference of 0.060%), and Immigrants from Armenia (65.3%, a difference of 0.080%).
| Demographics | Rating | Rank | In Labor Force | Age > 16 |
| Immigrants | Romania | 88.6 /100 | #144 | Excellent 65.5% |
| Tlingit-Haida | 88.3 /100 | #145 | Excellent 65.5% |
| Cypriots | 88.2 /100 | #146 | Excellent 65.5% |
| Immigrants | Oceania | 87.5 /100 | #147 | Excellent 65.5% |
| Bhutanese | 86.3 /100 | #148 | Excellent 65.5% |
| Immigrants | Albania | 85.7 /100 | #149 | Excellent 65.4% |
| Immigrants | Immigrants | 81.9 /100 | #150 | Excellent 65.4% |
| Czechs | 81.5 /100 | #151 | Excellent 65.4% |
| Yugoslavians | 81.3 /100 | #152 | Excellent 65.4% |
| Immigrants | China | 80.5 /100 | #153 | Excellent 65.4% |
| Immigrants | Eastern Europe | 78.3 /100 | #154 | Good 65.4% |
| Immigrants | Armenia | 76.6 /100 | #155 | Good 65.3% |
| Immigrants | Ireland | 75.9 /100 | #156 | Good 65.3% |
| Immigrants | Russia | 75.7 /100 | #157 | Good 65.3% |
| Panamanians | 75.2 /100 | #158 | Good 65.3% |