Immigrants from Norway vs Immigrants from Senegal In Labor Force | Age 20-24
COMPARE
Immigrants from Norway
Immigrants from Senegal
In Labor Force | Age 20-24
In Labor Force | Age 20-24 Comparison
Immigrants from Norway
Immigrants from Senegal
74.5%
IN LABOR FORCE | AGE 20-24
10.3/ 100
METRIC RATING
220th/ 347
METRIC RANK
74.0%
IN LABOR FORCE | AGE 20-24
2.1/ 100
METRIC RATING
241st/ 347
METRIC RANK
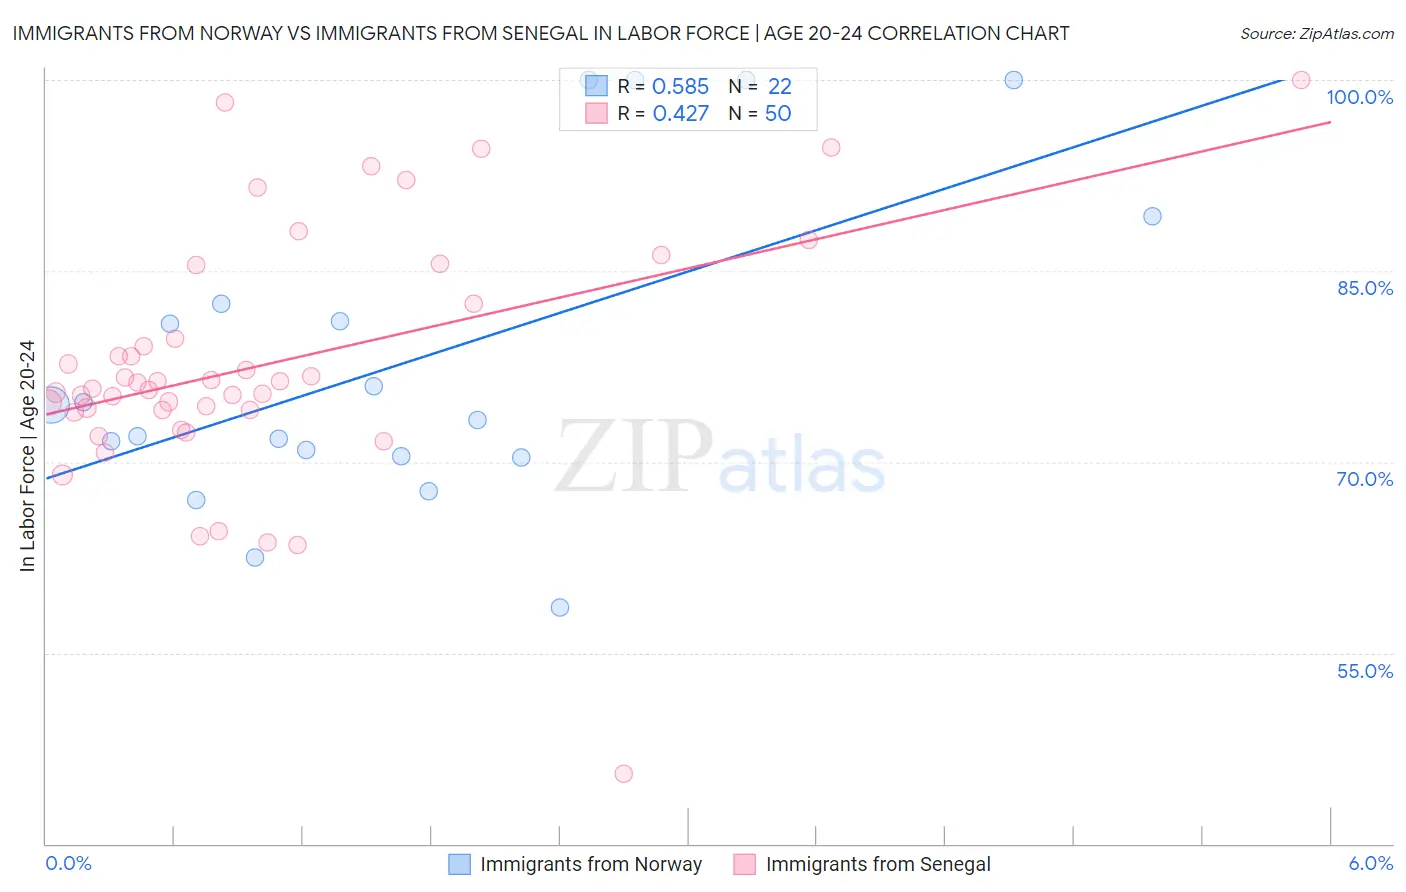
Immigrants from Norway vs Immigrants from Senegal In Labor Force | Age 20-24 Correlation Chart
The statistical analysis conducted on geographies consisting of 116,699,146 people shows a substantial positive correlation between the proportion of Immigrants from Norway and labor force participation rate among population between the ages 20 and 24 in the United States with a correlation coefficient (R) of 0.585 and weighted average of 74.5%. Similarly, the statistical analysis conducted on geographies consisting of 90,118,430 people shows a moderate positive correlation between the proportion of Immigrants from Senegal and labor force participation rate among population between the ages 20 and 24 in the United States with a correlation coefficient (R) of 0.427 and weighted average of 74.0%, a difference of 0.62%.
In Labor Force | Age 20-24 Correlation Summary
| Measurement | Immigrants from Norway | Immigrants from Senegal |
| Minimum | 58.6% | 45.5% |
| Maximum | 100.0% | 100.0% |
| Range | 41.4% | 54.5% |
| Mean | 77.9% | 77.7% |
| Median | 73.8% | 76.0% |
| Interquartile 25% (IQ1) | 70.5% | 74.1% |
| Interquartile 75% (IQ3) | 82.4% | 82.4% |
| Interquartile Range (IQR) | 11.9% | 8.3% |
| Standard Deviation (Sample) | 12.5% | 9.8% |
| Standard Deviation (Population) | 12.2% | 9.7% |
Similar Demographics by In Labor Force | Age 20-24
Demographics Similar to Immigrants from Norway by In Labor Force | Age 20-24
In terms of in labor force | age 20-24, the demographic groups most similar to Immigrants from Norway are Chickasaw (74.5%, a difference of 0.0%), Immigrants from Peru (74.5%, a difference of 0.010%), Nepalese (74.5%, a difference of 0.010%), Immigrants from India (74.4%, a difference of 0.020%), and Chilean (74.5%, a difference of 0.080%).
| Demographics | Rating | Rank | In Labor Force | Age 20-24 |
| Peruvians | 13.3 /100 | #213 | Poor 74.5% |
| Immigrants | Southern Europe | 13.2 /100 | #214 | Poor 74.5% |
| Immigrants | Ghana | 12.7 /100 | #215 | Poor 74.5% |
| Immigrants | Kuwait | 12.7 /100 | #216 | Poor 74.5% |
| Chileans | 12.5 /100 | #217 | Poor 74.5% |
| Immigrants | Peru | 10.6 /100 | #218 | Poor 74.5% |
| Nepalese | 10.5 /100 | #219 | Poor 74.5% |
| Immigrants | Norway | 10.3 /100 | #220 | Poor 74.5% |
| Chickasaw | 10.3 /100 | #221 | Poor 74.5% |
| Immigrants | India | 9.9 /100 | #222 | Tragic 74.4% |
| Hispanics or Latinos | 7.9 /100 | #223 | Tragic 74.4% |
| Seminole | 6.9 /100 | #224 | Tragic 74.3% |
| Ghanaians | 6.2 /100 | #225 | Tragic 74.3% |
| Immigrants | Fiji | 5.9 /100 | #226 | Tragic 74.3% |
| Immigrants | Ireland | 5.8 /100 | #227 | Tragic 74.3% |
Demographics Similar to Immigrants from Senegal by In Labor Force | Age 20-24
In terms of in labor force | age 20-24, the demographic groups most similar to Immigrants from Senegal are Thai (74.0%, a difference of 0.010%), Immigrants from Sri Lanka (74.0%, a difference of 0.030%), Immigrants from Syria (74.0%, a difference of 0.040%), Immigrants from South Central Asia (74.0%, a difference of 0.040%), and Turkish (73.9%, a difference of 0.070%).
| Demographics | Rating | Rank | In Labor Force | Age 20-24 |
| Immigrants | Immigrants | 3.6 /100 | #234 | Tragic 74.1% |
| Laotians | 3.5 /100 | #235 | Tragic 74.1% |
| Immigrants | France | 3.3 /100 | #236 | Tragic 74.1% |
| Bermudans | 3.2 /100 | #237 | Tragic 74.1% |
| Immigrants | Japan | 3.0 /100 | #238 | Tragic 74.1% |
| Immigrants | Latin America | 2.7 /100 | #239 | Tragic 74.1% |
| Immigrants | Sri Lanka | 2.3 /100 | #240 | Tragic 74.0% |
| Immigrants | Senegal | 2.1 /100 | #241 | Tragic 74.0% |
| Thais | 2.1 /100 | #242 | Tragic 74.0% |
| Immigrants | Syria | 1.9 /100 | #243 | Tragic 74.0% |
| Immigrants | South Central Asia | 1.9 /100 | #244 | Tragic 74.0% |
| Turks | 1.8 /100 | #245 | Tragic 73.9% |
| Immigrants | Panama | 1.6 /100 | #246 | Tragic 73.9% |
| Colville | 1.5 /100 | #247 | Tragic 73.9% |
| Immigrants | Saudi Arabia | 1.5 /100 | #248 | Tragic 73.9% |