Latvian vs Immigrants from Senegal In Labor Force | Age 20-24
COMPARE
Latvian
Immigrants from Senegal
In Labor Force | Age 20-24
In Labor Force | Age 20-24 Comparison
Latvians
Immigrants from Senegal
76.1%
IN LABOR FORCE | AGE 20-24
97.6/ 100
METRIC RATING
102nd/ 347
METRIC RANK
74.0%
IN LABOR FORCE | AGE 20-24
2.1/ 100
METRIC RATING
241st/ 347
METRIC RANK
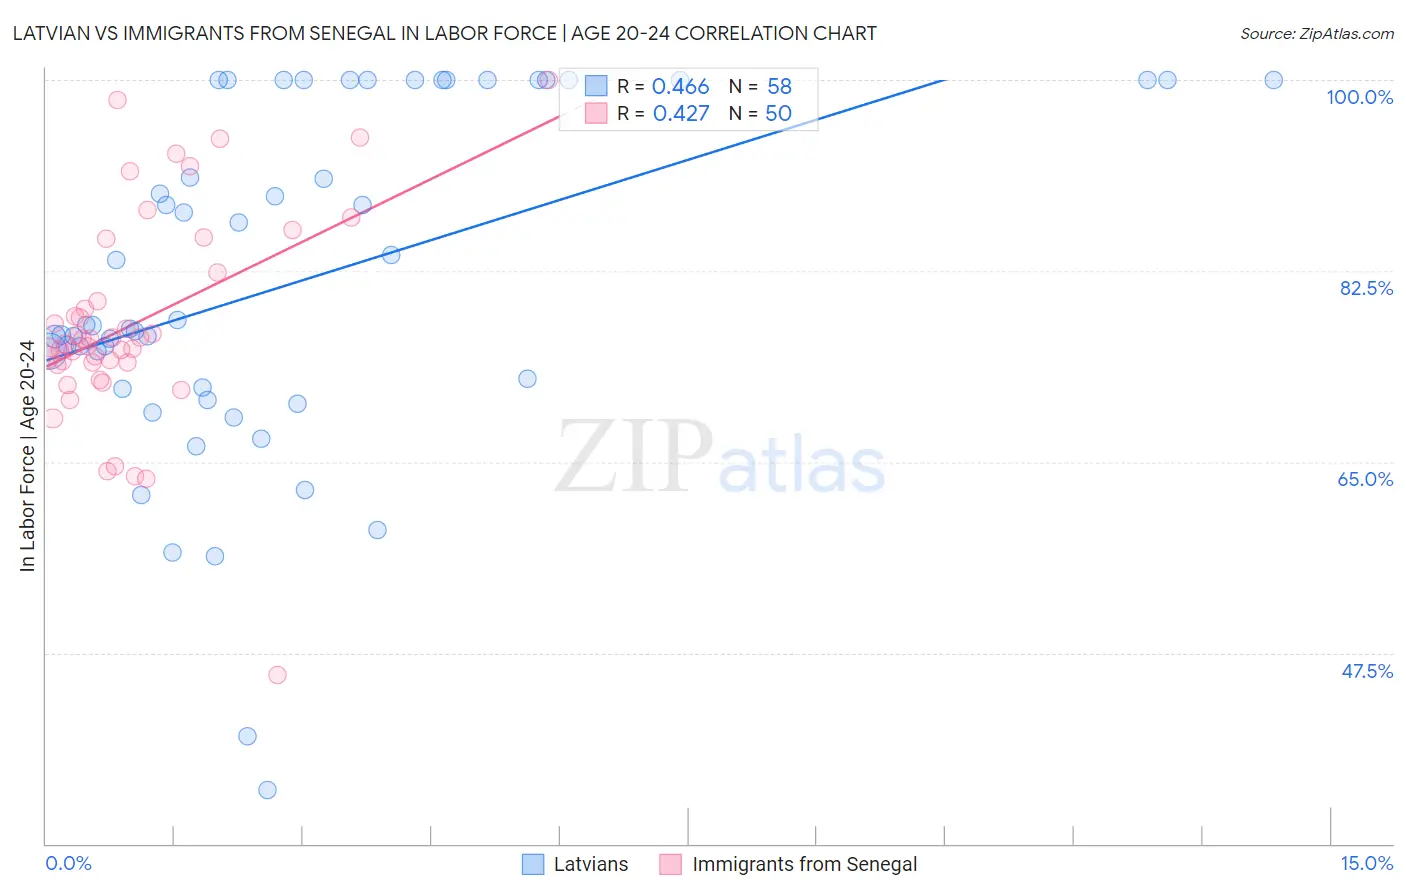
Latvian vs Immigrants from Senegal In Labor Force | Age 20-24 Correlation Chart
The statistical analysis conducted on geographies consisting of 220,651,647 people shows a moderate positive correlation between the proportion of Latvians and labor force participation rate among population between the ages 20 and 24 in the United States with a correlation coefficient (R) of 0.466 and weighted average of 76.1%. Similarly, the statistical analysis conducted on geographies consisting of 90,118,430 people shows a moderate positive correlation between the proportion of Immigrants from Senegal and labor force participation rate among population between the ages 20 and 24 in the United States with a correlation coefficient (R) of 0.427 and weighted average of 74.0%, a difference of 2.8%.
In Labor Force | Age 20-24 Correlation Summary
| Measurement | Latvian | Immigrants from Senegal |
| Minimum | 34.9% | 45.5% |
| Maximum | 100.0% | 100.0% |
| Range | 65.1% | 54.5% |
| Mean | 81.5% | 77.7% |
| Median | 77.5% | 76.0% |
| Interquartile 25% (IQ1) | 71.8% | 74.1% |
| Interquartile 75% (IQ3) | 100.0% | 82.4% |
| Interquartile Range (IQR) | 28.2% | 8.3% |
| Standard Deviation (Sample) | 15.9% | 9.8% |
| Standard Deviation (Population) | 15.7% | 9.7% |
Similar Demographics by In Labor Force | Age 20-24
Demographics Similar to Latvians by In Labor Force | Age 20-24
In terms of in labor force | age 20-24, the demographic groups most similar to Latvians are Immigrants from Poland (76.1%, a difference of 0.010%), Shoshone (76.1%, a difference of 0.020%), Immigrants from North Macedonia (76.1%, a difference of 0.020%), American (76.1%, a difference of 0.030%), and Immigrants from Lithuania (76.1%, a difference of 0.060%).
| Demographics | Rating | Rank | In Labor Force | Age 20-24 |
| Immigrants | Germany | 98.5 /100 | #95 | Exceptional 76.2% |
| Immigrants | Nonimmigrants | 98.5 /100 | #96 | Exceptional 76.2% |
| Immigrants | Lithuania | 98.0 /100 | #97 | Exceptional 76.1% |
| Immigrants | Oceania | 98.0 /100 | #98 | Exceptional 76.1% |
| Americans | 97.8 /100 | #99 | Exceptional 76.1% |
| Shoshone | 97.8 /100 | #100 | Exceptional 76.1% |
| Immigrants | Poland | 97.7 /100 | #101 | Exceptional 76.1% |
| Latvians | 97.6 /100 | #102 | Exceptional 76.1% |
| Immigrants | North Macedonia | 97.5 /100 | #103 | Exceptional 76.1% |
| Macedonians | 97.2 /100 | #104 | Exceptional 76.0% |
| Immigrants | Nepal | 97.2 /100 | #105 | Exceptional 76.0% |
| Immigrants | Uganda | 97.1 /100 | #106 | Exceptional 76.0% |
| Greeks | 96.9 /100 | #107 | Exceptional 76.0% |
| Iraqis | 96.6 /100 | #108 | Exceptional 76.0% |
| Cherokee | 95.8 /100 | #109 | Exceptional 75.9% |
Demographics Similar to Immigrants from Senegal by In Labor Force | Age 20-24
In terms of in labor force | age 20-24, the demographic groups most similar to Immigrants from Senegal are Thai (74.0%, a difference of 0.010%), Immigrants from Sri Lanka (74.0%, a difference of 0.030%), Immigrants from Syria (74.0%, a difference of 0.040%), Immigrants from South Central Asia (74.0%, a difference of 0.040%), and Turkish (73.9%, a difference of 0.070%).
| Demographics | Rating | Rank | In Labor Force | Age 20-24 |
| Immigrants | Immigrants | 3.6 /100 | #234 | Tragic 74.1% |
| Laotians | 3.5 /100 | #235 | Tragic 74.1% |
| Immigrants | France | 3.3 /100 | #236 | Tragic 74.1% |
| Bermudans | 3.2 /100 | #237 | Tragic 74.1% |
| Immigrants | Japan | 3.0 /100 | #238 | Tragic 74.1% |
| Immigrants | Latin America | 2.7 /100 | #239 | Tragic 74.1% |
| Immigrants | Sri Lanka | 2.3 /100 | #240 | Tragic 74.0% |
| Immigrants | Senegal | 2.1 /100 | #241 | Tragic 74.0% |
| Thais | 2.1 /100 | #242 | Tragic 74.0% |
| Immigrants | Syria | 1.9 /100 | #243 | Tragic 74.0% |
| Immigrants | South Central Asia | 1.9 /100 | #244 | Tragic 74.0% |
| Turks | 1.8 /100 | #245 | Tragic 73.9% |
| Immigrants | Panama | 1.6 /100 | #246 | Tragic 73.9% |
| Colville | 1.5 /100 | #247 | Tragic 73.9% |
| Immigrants | Saudi Arabia | 1.5 /100 | #248 | Tragic 73.9% |