Tlingit-Haida vs Native Hawaiian In Labor Force | Age 20-24
COMPARE
Tlingit-Haida
Native Hawaiian
In Labor Force | Age 20-24
In Labor Force | Age 20-24 Comparison
Tlingit-Haida
Native Hawaiians
77.9%
IN LABOR FORCE | AGE 20-24
100.0/ 100
METRIC RATING
25th/ 347
METRIC RANK
77.4%
IN LABOR FORCE | AGE 20-24
100.0/ 100
METRIC RATING
45th/ 347
METRIC RANK
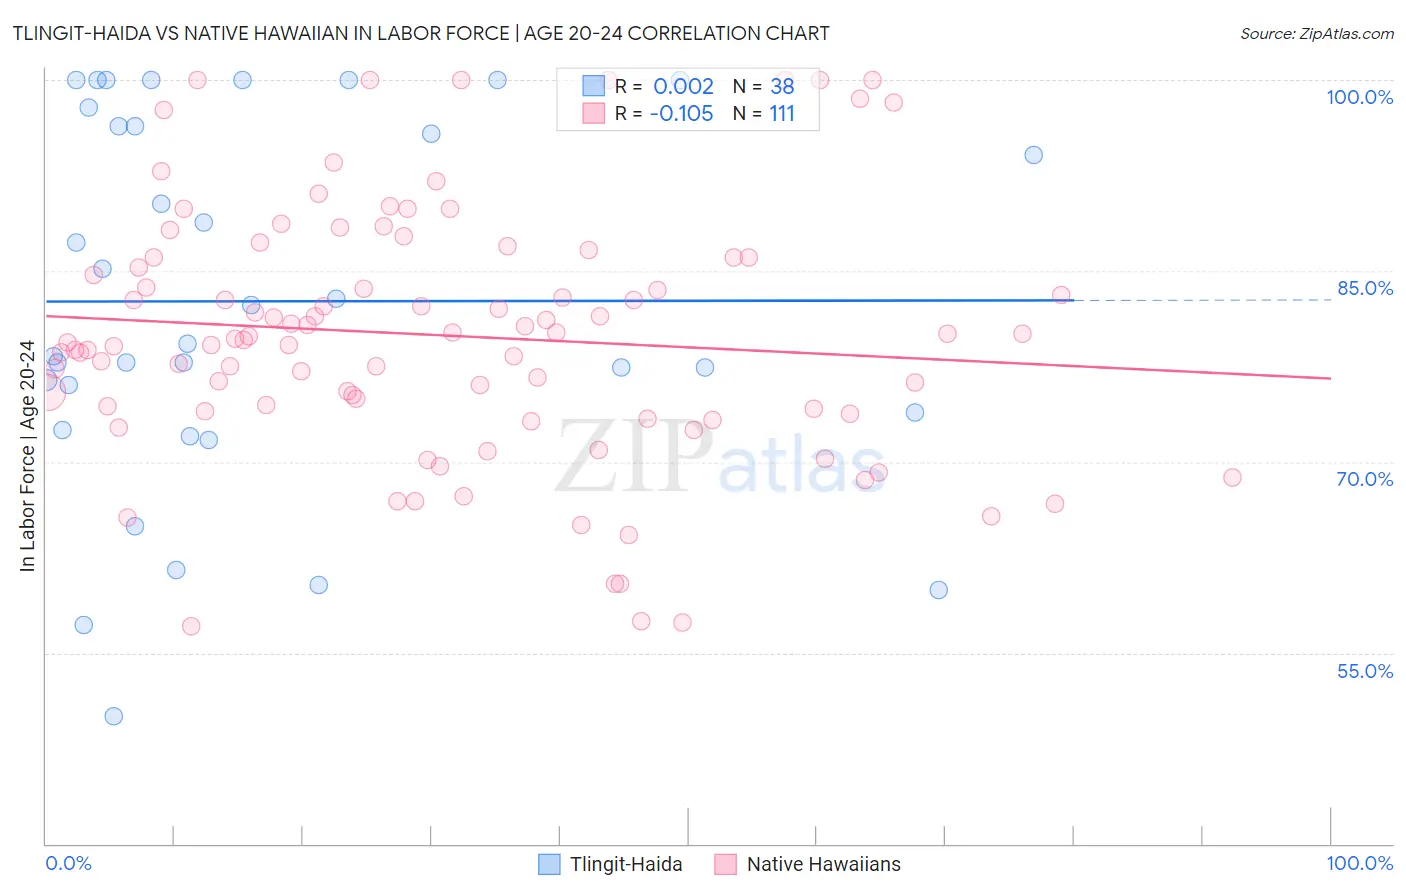
Tlingit-Haida vs Native Hawaiian In Labor Force | Age 20-24 Correlation Chart
The statistical analysis conducted on geographies consisting of 60,858,700 people shows no correlation between the proportion of Tlingit-Haida and labor force participation rate among population between the ages 20 and 24 in the United States with a correlation coefficient (R) of 0.002 and weighted average of 77.9%. Similarly, the statistical analysis conducted on geographies consisting of 331,991,642 people shows a poor negative correlation between the proportion of Native Hawaiians and labor force participation rate among population between the ages 20 and 24 in the United States with a correlation coefficient (R) of -0.105 and weighted average of 77.4%, a difference of 0.73%.
In Labor Force | Age 20-24 Correlation Summary
| Measurement | Tlingit-Haida | Native Hawaiian |
| Minimum | 50.0% | 57.1% |
| Maximum | 100.0% | 100.0% |
| Range | 50.0% | 42.9% |
| Mean | 82.6% | 79.9% |
| Median | 80.8% | 79.6% |
| Interquartile 25% (IQ1) | 73.9% | 74.0% |
| Interquartile 75% (IQ3) | 96.4% | 86.1% |
| Interquartile Range (IQR) | 22.5% | 12.1% |
| Standard Deviation (Sample) | 14.3% | 9.9% |
| Standard Deviation (Population) | 14.1% | 9.9% |
Demographics Similar to Tlingit-Haida and Native Hawaiians by In Labor Force | Age 20-24
In terms of in labor force | age 20-24, the demographic groups most similar to Tlingit-Haida are Tongan (77.9%, a difference of 0.020%), Immigrants from Micronesia (77.8%, a difference of 0.14%), Belgian (77.8%, a difference of 0.18%), Slovak (77.7%, a difference of 0.26%), and Swiss (77.7%, a difference of 0.28%). Similarly, the demographic groups most similar to Native Hawaiians are Fijian (77.4%, a difference of 0.010%), Immigrants from Laos (77.4%, a difference of 0.020%), French (77.4%, a difference of 0.030%), Immigrants from Congo (77.4%, a difference of 0.040%), and Scottish (77.4%, a difference of 0.050%).
| Demographics | Rating | Rank | In Labor Force | Age 20-24 |
| Tlingit-Haida | 100.0 /100 | #25 | Exceptional 77.9% |
| Tongans | 100.0 /100 | #26 | Exceptional 77.9% |
| Immigrants | Micronesia | 100.0 /100 | #27 | Exceptional 77.8% |
| Belgians | 100.0 /100 | #28 | Exceptional 77.8% |
| Slovaks | 100.0 /100 | #29 | Exceptional 77.7% |
| Swiss | 100.0 /100 | #30 | Exceptional 77.7% |
| Poles | 100.0 /100 | #31 | Exceptional 77.6% |
| English | 100.0 /100 | #32 | Exceptional 77.6% |
| Immigrants | Ethiopia | 100.0 /100 | #33 | Exceptional 77.5% |
| German Russians | 100.0 /100 | #34 | Exceptional 77.5% |
| Immigrants | Eastern Africa | 100.0 /100 | #35 | Exceptional 77.5% |
| Welsh | 100.0 /100 | #36 | Exceptional 77.5% |
| Czechoslovakians | 100.0 /100 | #37 | Exceptional 77.5% |
| Marshallese | 100.0 /100 | #38 | Exceptional 77.4% |
| Irish | 100.0 /100 | #39 | Exceptional 77.4% |
| Scottish | 100.0 /100 | #40 | Exceptional 77.4% |
| Immigrants | Congo | 100.0 /100 | #41 | Exceptional 77.4% |
| French | 100.0 /100 | #42 | Exceptional 77.4% |
| Immigrants | Laos | 100.0 /100 | #43 | Exceptional 77.4% |
| Fijians | 100.0 /100 | #44 | Exceptional 77.4% |
| Native Hawaiians | 100.0 /100 | #45 | Exceptional 77.4% |