Kiowa vs Immigrants from Senegal In Labor Force | Age 20-24
COMPARE
Kiowa
Immigrants from Senegal
In Labor Force | Age 20-24
In Labor Force | Age 20-24 Comparison
Kiowa
Immigrants from Senegal
73.2%
IN LABOR FORCE | AGE 20-24
0.1/ 100
METRIC RATING
284th/ 347
METRIC RANK
74.0%
IN LABOR FORCE | AGE 20-24
2.1/ 100
METRIC RATING
241st/ 347
METRIC RANK
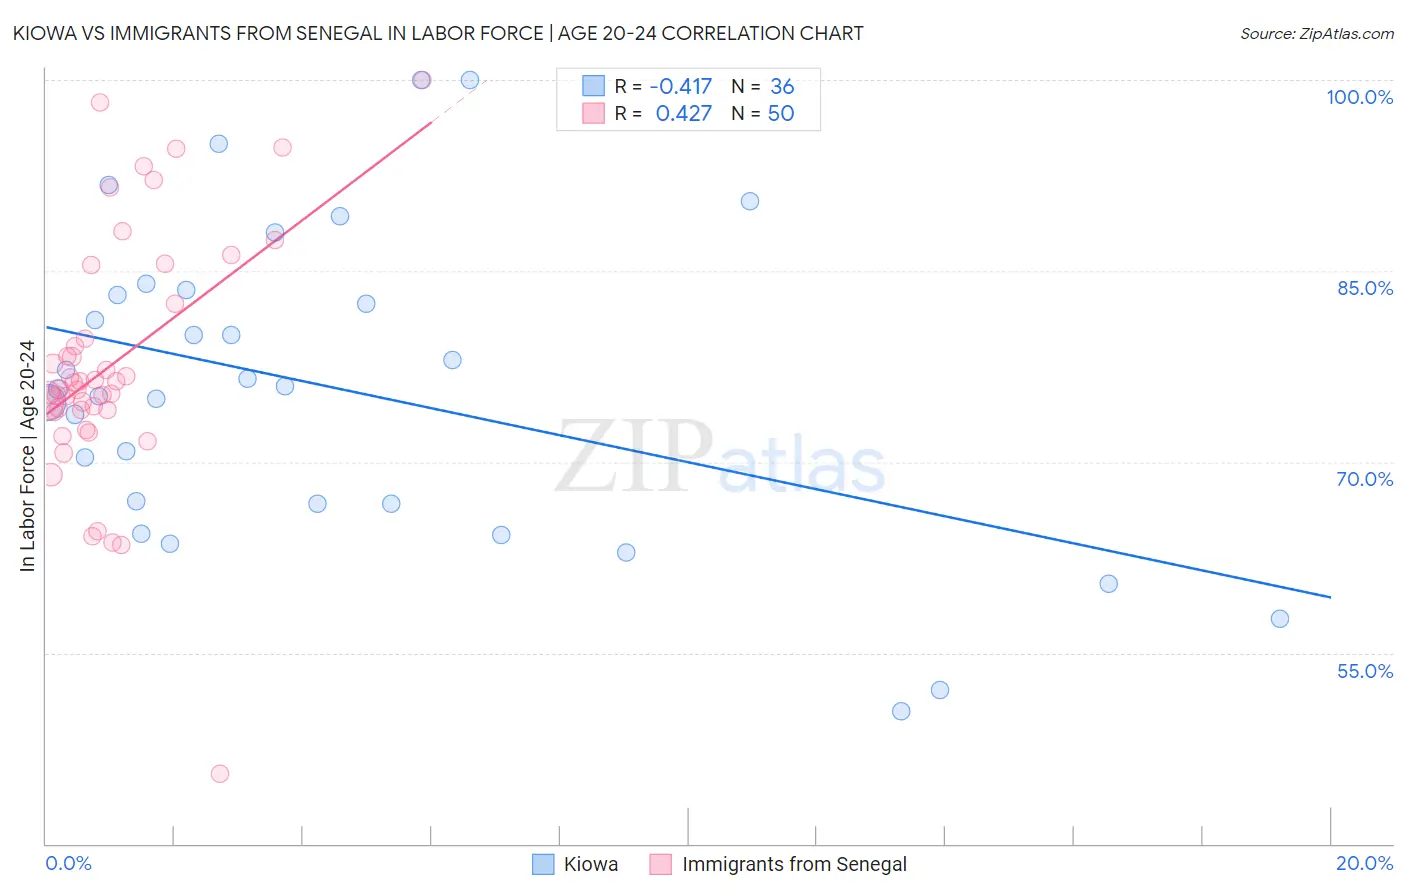
Kiowa vs Immigrants from Senegal In Labor Force | Age 20-24 Correlation Chart
The statistical analysis conducted on geographies consisting of 56,096,922 people shows a moderate negative correlation between the proportion of Kiowa and labor force participation rate among population between the ages 20 and 24 in the United States with a correlation coefficient (R) of -0.417 and weighted average of 73.2%. Similarly, the statistical analysis conducted on geographies consisting of 90,118,430 people shows a moderate positive correlation between the proportion of Immigrants from Senegal and labor force participation rate among population between the ages 20 and 24 in the United States with a correlation coefficient (R) of 0.427 and weighted average of 74.0%, a difference of 1.1%.
In Labor Force | Age 20-24 Correlation Summary
| Measurement | Kiowa | Immigrants from Senegal |
| Minimum | 50.4% | 45.5% |
| Maximum | 100.0% | 100.0% |
| Range | 49.6% | 54.5% |
| Mean | 75.8% | 77.7% |
| Median | 75.9% | 76.0% |
| Interquartile 25% (IQ1) | 66.7% | 74.1% |
| Interquartile 75% (IQ3) | 83.3% | 82.4% |
| Interquartile Range (IQR) | 16.6% | 8.3% |
| Standard Deviation (Sample) | 12.3% | 9.8% |
| Standard Deviation (Population) | 12.1% | 9.7% |
Similar Demographics by In Labor Force | Age 20-24
Demographics Similar to Kiowa by In Labor Force | Age 20-24
In terms of in labor force | age 20-24, the demographic groups most similar to Kiowa are Immigrants from Bahamas (73.2%, a difference of 0.020%), Immigrants from Spain (73.2%, a difference of 0.030%), Immigrants from Venezuela (73.2%, a difference of 0.040%), Nicaraguan (73.2%, a difference of 0.060%), and Bahamian (73.3%, a difference of 0.070%).
| Demographics | Rating | Rank | In Labor Force | Age 20-24 |
| Immigrants | Malaysia | 0.2 /100 | #277 | Tragic 73.3% |
| Cypriots | 0.2 /100 | #278 | Tragic 73.3% |
| Venezuelans | 0.2 /100 | #279 | Tragic 73.3% |
| Bahamians | 0.1 /100 | #280 | Tragic 73.3% |
| Immigrants | Venezuela | 0.1 /100 | #281 | Tragic 73.2% |
| Immigrants | Spain | 0.1 /100 | #282 | Tragic 73.2% |
| Immigrants | Bahamas | 0.1 /100 | #283 | Tragic 73.2% |
| Kiowa | 0.1 /100 | #284 | Tragic 73.2% |
| Nicaraguans | 0.1 /100 | #285 | Tragic 73.2% |
| Immigrants | Lebanon | 0.1 /100 | #286 | Tragic 73.1% |
| Immigrants | Korea | 0.1 /100 | #287 | Tragic 73.1% |
| Argentineans | 0.1 /100 | #288 | Tragic 73.1% |
| U.S. Virgin Islanders | 0.1 /100 | #289 | Tragic 73.0% |
| Immigrants | Belarus | 0.1 /100 | #290 | Tragic 73.0% |
| Immigrants | Nicaragua | 0.0 /100 | #291 | Tragic 72.9% |
Demographics Similar to Immigrants from Senegal by In Labor Force | Age 20-24
In terms of in labor force | age 20-24, the demographic groups most similar to Immigrants from Senegal are Thai (74.0%, a difference of 0.010%), Immigrants from Sri Lanka (74.0%, a difference of 0.030%), Immigrants from Syria (74.0%, a difference of 0.040%), Immigrants from South Central Asia (74.0%, a difference of 0.040%), and Turkish (73.9%, a difference of 0.070%).
| Demographics | Rating | Rank | In Labor Force | Age 20-24 |
| Immigrants | Immigrants | 3.6 /100 | #234 | Tragic 74.1% |
| Laotians | 3.5 /100 | #235 | Tragic 74.1% |
| Immigrants | France | 3.3 /100 | #236 | Tragic 74.1% |
| Bermudans | 3.2 /100 | #237 | Tragic 74.1% |
| Immigrants | Japan | 3.0 /100 | #238 | Tragic 74.1% |
| Immigrants | Latin America | 2.7 /100 | #239 | Tragic 74.1% |
| Immigrants | Sri Lanka | 2.3 /100 | #240 | Tragic 74.0% |
| Immigrants | Senegal | 2.1 /100 | #241 | Tragic 74.0% |
| Thais | 2.1 /100 | #242 | Tragic 74.0% |
| Immigrants | Syria | 1.9 /100 | #243 | Tragic 74.0% |
| Immigrants | South Central Asia | 1.9 /100 | #244 | Tragic 74.0% |
| Turks | 1.8 /100 | #245 | Tragic 73.9% |
| Immigrants | Panama | 1.6 /100 | #246 | Tragic 73.9% |
| Colville | 1.5 /100 | #247 | Tragic 73.9% |
| Immigrants | Saudi Arabia | 1.5 /100 | #248 | Tragic 73.9% |