Tlingit-Haida vs Immigrants from Argentina In Labor Force | Age 20-24
COMPARE
Tlingit-Haida
Immigrants from Argentina
In Labor Force | Age 20-24
In Labor Force | Age 20-24 Comparison
Tlingit-Haida
Immigrants from Argentina
77.9%
IN LABOR FORCE | AGE 20-24
100.0/ 100
METRIC RATING
25th/ 347
METRIC RANK
72.8%
IN LABOR FORCE | AGE 20-24
0.0/ 100
METRIC RATING
294th/ 347
METRIC RANK
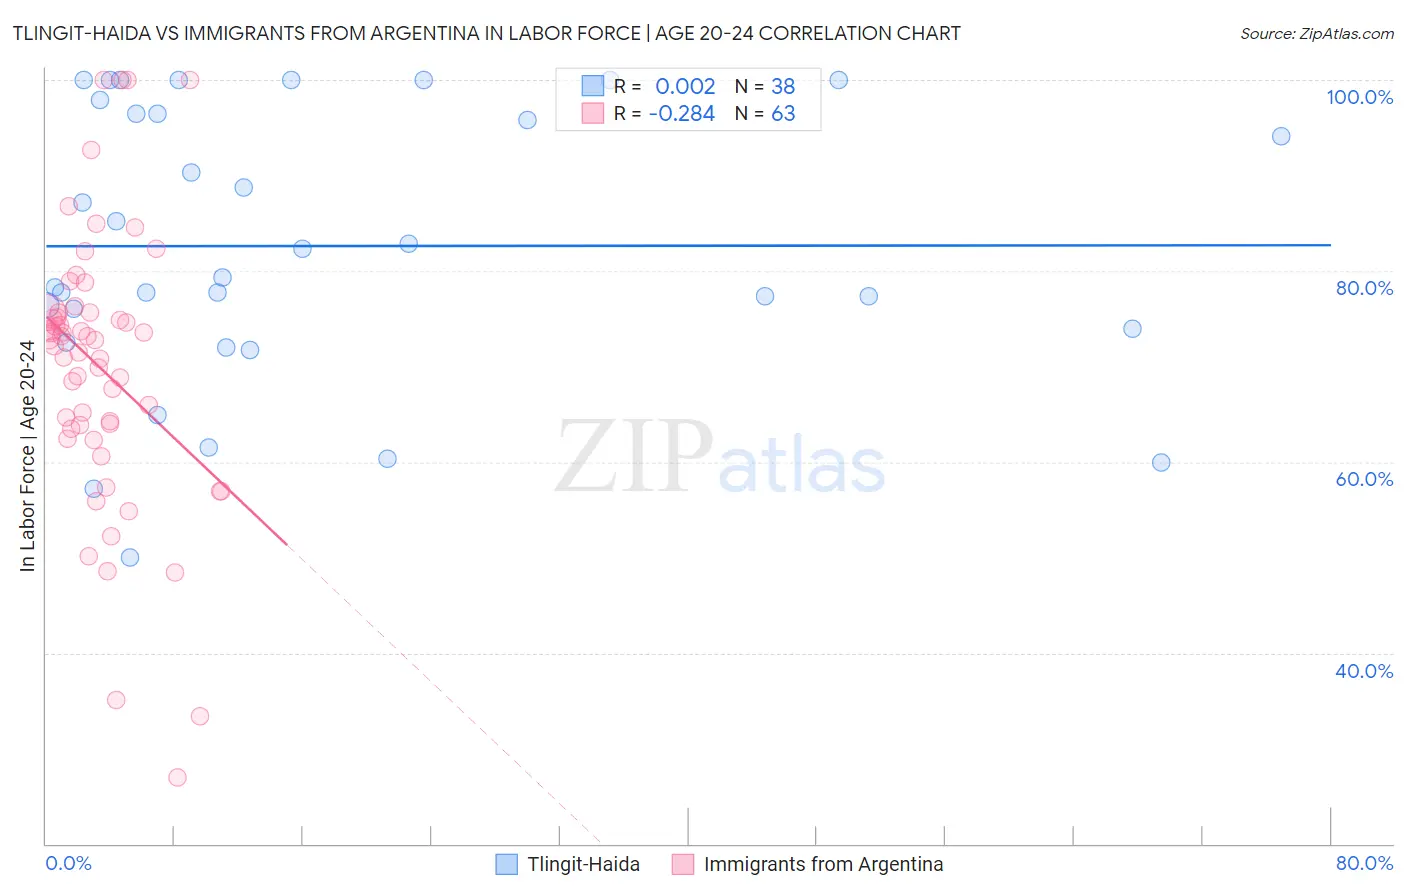
Tlingit-Haida vs Immigrants from Argentina In Labor Force | Age 20-24 Correlation Chart
The statistical analysis conducted on geographies consisting of 60,858,700 people shows no correlation between the proportion of Tlingit-Haida and labor force participation rate among population between the ages 20 and 24 in the United States with a correlation coefficient (R) of 0.002 and weighted average of 77.9%. Similarly, the statistical analysis conducted on geographies consisting of 264,369,476 people shows a weak negative correlation between the proportion of Immigrants from Argentina and labor force participation rate among population between the ages 20 and 24 in the United States with a correlation coefficient (R) of -0.284 and weighted average of 72.8%, a difference of 7.0%.
In Labor Force | Age 20-24 Correlation Summary
| Measurement | Tlingit-Haida | Immigrants from Argentina |
| Minimum | 50.0% | 26.9% |
| Maximum | 100.0% | 100.0% |
| Range | 50.0% | 73.1% |
| Mean | 82.6% | 69.9% |
| Median | 80.8% | 72.8% |
| Interquartile 25% (IQ1) | 73.9% | 63.5% |
| Interquartile 75% (IQ3) | 96.4% | 75.7% |
| Interquartile Range (IQR) | 22.5% | 12.2% |
| Standard Deviation (Sample) | 14.3% | 14.6% |
| Standard Deviation (Population) | 14.1% | 14.5% |
Similar Demographics by In Labor Force | Age 20-24
Demographics Similar to Tlingit-Haida by In Labor Force | Age 20-24
In terms of in labor force | age 20-24, the demographic groups most similar to Tlingit-Haida are Tongan (77.9%, a difference of 0.020%), Yugoslavian (78.0%, a difference of 0.040%), Liberian (78.0%, a difference of 0.040%), Pennsylvania German (78.0%, a difference of 0.050%), and Puget Sound Salish (78.0%, a difference of 0.11%).
| Demographics | Rating | Rank | In Labor Force | Age 20-24 |
| Immigrants | Bosnia and Herzegovina | 100.0 /100 | #18 | Exceptional 78.1% |
| Bangladeshis | 100.0 /100 | #19 | Exceptional 78.1% |
| French Canadians | 100.0 /100 | #20 | Exceptional 78.1% |
| Puget Sound Salish | 100.0 /100 | #21 | Exceptional 78.0% |
| Pennsylvania Germans | 100.0 /100 | #22 | Exceptional 78.0% |
| Yugoslavians | 100.0 /100 | #23 | Exceptional 78.0% |
| Liberians | 100.0 /100 | #24 | Exceptional 78.0% |
| Tlingit-Haida | 100.0 /100 | #25 | Exceptional 77.9% |
| Tongans | 100.0 /100 | #26 | Exceptional 77.9% |
| Immigrants | Micronesia | 100.0 /100 | #27 | Exceptional 77.8% |
| Belgians | 100.0 /100 | #28 | Exceptional 77.8% |
| Slovaks | 100.0 /100 | #29 | Exceptional 77.7% |
| Swiss | 100.0 /100 | #30 | Exceptional 77.7% |
| Poles | 100.0 /100 | #31 | Exceptional 77.6% |
| English | 100.0 /100 | #32 | Exceptional 77.6% |
Demographics Similar to Immigrants from Argentina by In Labor Force | Age 20-24
In terms of in labor force | age 20-24, the demographic groups most similar to Immigrants from Argentina are Immigrants from Belize (72.8%, a difference of 0.030%), Pueblo (72.9%, a difference of 0.090%), Okinawan (72.7%, a difference of 0.11%), Jamaican (72.7%, a difference of 0.11%), and Central American Indian (72.7%, a difference of 0.16%).
| Demographics | Rating | Rank | In Labor Force | Age 20-24 |
| Immigrants | Korea | 0.1 /100 | #287 | Tragic 73.1% |
| Argentineans | 0.1 /100 | #288 | Tragic 73.1% |
| U.S. Virgin Islanders | 0.1 /100 | #289 | Tragic 73.0% |
| Immigrants | Belarus | 0.1 /100 | #290 | Tragic 73.0% |
| Immigrants | Nicaragua | 0.0 /100 | #291 | Tragic 72.9% |
| Pueblo | 0.0 /100 | #292 | Tragic 72.9% |
| Immigrants | Belize | 0.0 /100 | #293 | Tragic 72.8% |
| Immigrants | Argentina | 0.0 /100 | #294 | Tragic 72.8% |
| Okinawans | 0.0 /100 | #295 | Tragic 72.7% |
| Jamaicans | 0.0 /100 | #296 | Tragic 72.7% |
| Central American Indians | 0.0 /100 | #297 | Tragic 72.7% |
| Israelis | 0.0 /100 | #298 | Tragic 72.6% |
| Iranians | 0.0 /100 | #299 | Tragic 72.6% |
| Armenians | 0.0 /100 | #300 | Tragic 72.5% |
| Cubans | 0.0 /100 | #301 | Tragic 72.5% |