Immigrants from Kenya vs Immigrants from Senegal In Labor Force | Age 20-24
COMPARE
Immigrants from Kenya
Immigrants from Senegal
In Labor Force | Age 20-24
In Labor Force | Age 20-24 Comparison
Immigrants from Kenya
Immigrants from Senegal
77.0%
IN LABOR FORCE | AGE 20-24
99.9/ 100
METRIC RATING
62nd/ 347
METRIC RANK
74.0%
IN LABOR FORCE | AGE 20-24
2.1/ 100
METRIC RATING
241st/ 347
METRIC RANK
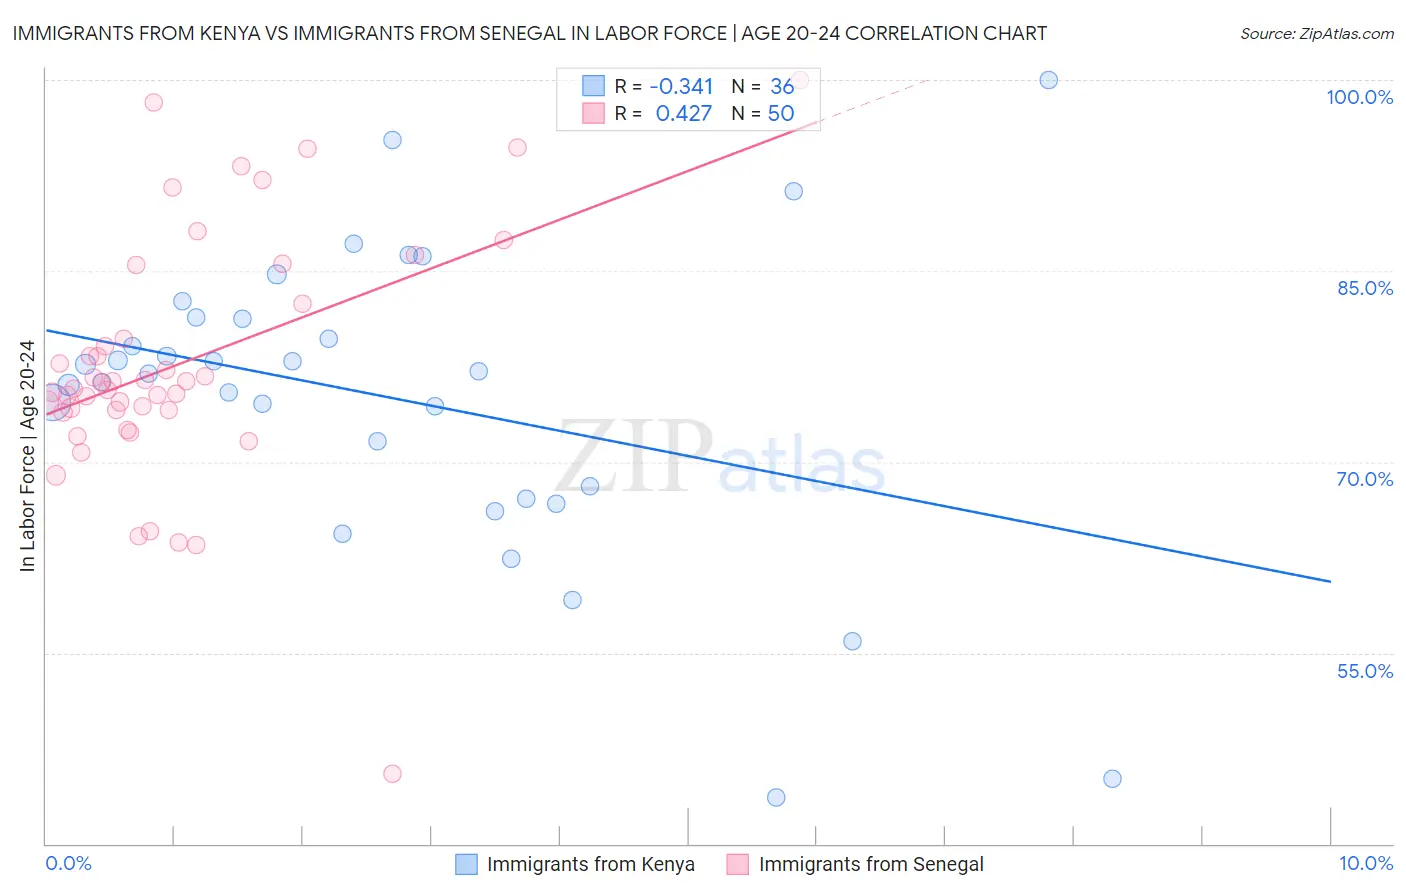
Immigrants from Kenya vs Immigrants from Senegal In Labor Force | Age 20-24 Correlation Chart
The statistical analysis conducted on geographies consisting of 218,076,104 people shows a mild negative correlation between the proportion of Immigrants from Kenya and labor force participation rate among population between the ages 20 and 24 in the United States with a correlation coefficient (R) of -0.341 and weighted average of 77.0%. Similarly, the statistical analysis conducted on geographies consisting of 90,118,430 people shows a moderate positive correlation between the proportion of Immigrants from Senegal and labor force participation rate among population between the ages 20 and 24 in the United States with a correlation coefficient (R) of 0.427 and weighted average of 74.0%, a difference of 4.0%.
In Labor Force | Age 20-24 Correlation Summary
| Measurement | Immigrants from Kenya | Immigrants from Senegal |
| Minimum | 43.6% | 45.5% |
| Maximum | 100.0% | 100.0% |
| Range | 56.4% | 54.5% |
| Mean | 75.0% | 77.7% |
| Median | 77.0% | 76.0% |
| Interquartile 25% (IQ1) | 67.6% | 74.1% |
| Interquartile 75% (IQ3) | 81.3% | 82.4% |
| Interquartile Range (IQR) | 13.7% | 8.3% |
| Standard Deviation (Sample) | 12.0% | 9.8% |
| Standard Deviation (Population) | 11.9% | 9.7% |
Similar Demographics by In Labor Force | Age 20-24
Demographics Similar to Immigrants from Kenya by In Labor Force | Age 20-24
In terms of in labor force | age 20-24, the demographic groups most similar to Immigrants from Kenya are Lithuanian (77.0%, a difference of 0.0%), Immigrants from Eritrea (77.0%, a difference of 0.010%), White/Caucasian (76.9%, a difference of 0.040%), Kenyan (77.0%, a difference of 0.060%), and Scotch-Irish (77.0%, a difference of 0.090%).
| Demographics | Rating | Rank | In Labor Force | Age 20-24 |
| Immigrants | Liberia | 99.9 /100 | #55 | Exceptional 77.1% |
| Europeans | 99.9 /100 | #56 | Exceptional 77.1% |
| Chippewa | 99.9 /100 | #57 | Exceptional 77.1% |
| Hawaiians | 99.9 /100 | #58 | Exceptional 77.0% |
| Scotch-Irish | 99.9 /100 | #59 | Exceptional 77.0% |
| Kenyans | 99.9 /100 | #60 | Exceptional 77.0% |
| Immigrants | Eritrea | 99.9 /100 | #61 | Exceptional 77.0% |
| Immigrants | Kenya | 99.9 /100 | #62 | Exceptional 77.0% |
| Lithuanians | 99.9 /100 | #63 | Exceptional 77.0% |
| Whites/Caucasians | 99.9 /100 | #64 | Exceptional 76.9% |
| Crow | 99.9 /100 | #65 | Exceptional 76.9% |
| Icelanders | 99.9 /100 | #66 | Exceptional 76.9% |
| Slavs | 99.9 /100 | #67 | Exceptional 76.9% |
| French American Indians | 99.8 /100 | #68 | Exceptional 76.8% |
| Immigrants | Sudan | 99.8 /100 | #69 | Exceptional 76.8% |
Demographics Similar to Immigrants from Senegal by In Labor Force | Age 20-24
In terms of in labor force | age 20-24, the demographic groups most similar to Immigrants from Senegal are Thai (74.0%, a difference of 0.010%), Immigrants from Sri Lanka (74.0%, a difference of 0.030%), Immigrants from Syria (74.0%, a difference of 0.040%), Immigrants from South Central Asia (74.0%, a difference of 0.040%), and Turkish (73.9%, a difference of 0.070%).
| Demographics | Rating | Rank | In Labor Force | Age 20-24 |
| Immigrants | Immigrants | 3.6 /100 | #234 | Tragic 74.1% |
| Laotians | 3.5 /100 | #235 | Tragic 74.1% |
| Immigrants | France | 3.3 /100 | #236 | Tragic 74.1% |
| Bermudans | 3.2 /100 | #237 | Tragic 74.1% |
| Immigrants | Japan | 3.0 /100 | #238 | Tragic 74.1% |
| Immigrants | Latin America | 2.7 /100 | #239 | Tragic 74.1% |
| Immigrants | Sri Lanka | 2.3 /100 | #240 | Tragic 74.0% |
| Immigrants | Senegal | 2.1 /100 | #241 | Tragic 74.0% |
| Thais | 2.1 /100 | #242 | Tragic 74.0% |
| Immigrants | Syria | 1.9 /100 | #243 | Tragic 74.0% |
| Immigrants | South Central Asia | 1.9 /100 | #244 | Tragic 74.0% |
| Turks | 1.8 /100 | #245 | Tragic 73.9% |
| Immigrants | Panama | 1.6 /100 | #246 | Tragic 73.9% |
| Colville | 1.5 /100 | #247 | Tragic 73.9% |
| Immigrants | Saudi Arabia | 1.5 /100 | #248 | Tragic 73.9% |