Immigrants from Scotland vs Immigrants from Senegal In Labor Force | Age 20-24

COMPARE

Immigrants from Scotland
Race
Ancestry
AfghanAfricanAlaska NativeAlaskan AthabascanAlbanianAleutAlsatianAmericanApacheArabArapahoArgentineanArmenianAssyrian/Chaldean/SyriacAustralianAustrianBahamianBangladeshiBarbadianBasqueBelgianBelizeanBermudanBhutaneseBlackfeetBolivianBrazilianBritishBritish West IndianBulgarianBurmeseCajunCambodianCanadianCape VerdeanCarpatho RusynCelticCentral AmericanCentral American IndianCherokeeCheyenneChickasawChileanChineseChippewaChoctawColombianColvilleComancheCosta RicanCreeCreekCroatianCrowCubanCypriotCzechCzechoslovakianDanishDelawareDominicanDutchDutch West IndianEastern EuropeanEcuadorianEgyptianEnglishEstonianEthiopianEuropeanFijianFilipinoFinnishFrenchFrench American IndianFrench CanadianGermanGerman RussianGhanaianGreekGuamanian/ChamorroGuatemalanGuyaneseHaitianHmongHonduranHopiHoumaHungarianIcelanderIndian (Asian)IndonesianInupiatIranianIraqiIrishIroquoisIsraeliItalianJamaicanJapaneseJordanianKenyanKiowaKoreanLaotianLatvianLebaneseLiberianLithuanianLumbeeLuxembourgerMacedonianMalaysianMalteseMarshalleseMenomineeMexicanMexican American IndianMongolianMoroccanNative HawaiianNavajoNepaleseNew ZealanderNicaraguanNigerianNorthern EuropeanNorwegianOkinawanOsageOttawaPaiutePakistaniPalestinianPanamanianParaguayanPennsylvania GermanPeruvianPimaPolishPortuguesePotawatomiPuebloPuerto RicanPuget Sound SalishRomanianRussianSalvadoranSamoanScandinavianScotch-IrishScottishSeminoleSenegaleseSerbianShoshoneSierra LeoneanSiouxSlavicSlovakSloveneSomaliSouth AfricanSouth AmericanSouth American IndianSoviet UnionSpaniardSpanishSpanish AmericanSpanish American IndianSri LankanSubsaharan AfricanSudaneseSwedishSwissSyrianTaiwaneseThaiTlingit-HaidaTohono O'OdhamTonganTrinidadian and TobagonianTsimshianTurkishU.S. Virgin IslanderUgandanUkrainianUruguayanUteVenezuelanVietnameseWelshWest IndianYakamaYaquiYugoslavianYumanYup'ikZimbabwean
Immigration
NonimmigrantsImmigrantsAfghanistanAfricaAlbaniaArgentinaArmeniaAsiaAustraliaAustriaBahamasBangladeshBarbadosBelarusBelgiumBelizeBoliviaBosnia and HerzegovinaBrazilBulgariaBurma/MyanmarCabo VerdeCambodiaCameroonCanadaCaribbeanCentral AmericaChileChinaColombiaCongoCosta RicaCroatiaCubaCzechoslovakiaDenmarkDominicaDominican RepublicEastern AfricaEastern AsiaEastern EuropeEcuadorEgyptEl SalvadorEnglandEritreaEthiopiaEuropeFijiFranceGermanyGhanaGreeceGrenadaGuatemalaGuyanaHaitiHondurasHong KongHungaryIndiaIndonesiaIranIraqIrelandIsraelItalyJamaicaJapanJordanKazakhstanKenyaKoreaKuwaitLaosLatin AmericaLatviaLebanonLiberiaLithuaniaMalaysiaMexicoMicronesiaMiddle AfricaMoldovaMoroccoNepalNetherlandsNicaraguaNigeriaNorth AmericaNorth MacedoniaNorthern AfricaNorthern EuropeNorwayOceaniaPakistanPanamaPeruPhilippinesPolandPortugalRomaniaRussiaSaudi ArabiaScotlandSerbiaSierra LeoneSingaporeSomaliaSouth AfricaSouth AmericaSouth Central AsiaSouth Eastern AsiaSouthern EuropeSpainSri LankaSt. Vincent and the GrenadinesSudanSwedenSwitzerlandSyriaTaiwanThailandTrinidad and TobagoTurkeyUgandaUkraineUruguayUzbekistanVenezuelaVietnamWest IndiesWestern AfricaWestern AsiaWestern EuropeYemenZaireZimbabweAzores
Immigrants from Senegal
Race
Ancestry
AfghanAfricanAlaska NativeAlaskan AthabascanAlbanianAleutAlsatianAmericanApacheArabArapahoArgentineanArmenianAssyrian/Chaldean/SyriacAustralianAustrianBahamianBangladeshiBarbadianBasqueBelgianBelizeanBermudanBhutaneseBlackfeetBolivianBrazilianBritishBritish West IndianBulgarianBurmeseCajunCambodianCanadianCape VerdeanCarpatho RusynCelticCentral AmericanCentral American IndianCherokeeCheyenneChickasawChileanChineseChippewaChoctawColombianColvilleComancheCosta RicanCreeCreekCroatianCrowCubanCypriotCzechCzechoslovakianDanishDelawareDominicanDutchDutch West IndianEastern EuropeanEcuadorianEgyptianEnglishEstonianEthiopianEuropeanFijianFilipinoFinnishFrenchFrench American IndianFrench CanadianGermanGerman RussianGhanaianGreekGuamanian/ChamorroGuatemalanGuyaneseHaitianHmongHonduranHopiHoumaHungarianIcelanderIndian (Asian)IndonesianInupiatIranianIraqiIrishIroquoisIsraeliItalianJamaicanJapaneseJordanianKenyanKiowaKoreanLaotianLatvianLebaneseLiberianLithuanianLumbeeLuxembourgerMacedonianMalaysianMalteseMarshalleseMenomineeMexicanMexican American IndianMongolianMoroccanNative HawaiianNavajoNepaleseNew ZealanderNicaraguanNigerianNorthern EuropeanNorwegianOkinawanOsageOttawaPaiutePakistaniPalestinianPanamanianParaguayanPennsylvania GermanPeruvianPimaPolishPortuguesePotawatomiPuebloPuerto RicanPuget Sound SalishRomanianRussianSalvadoranSamoanScandinavianScotch-IrishScottishSeminoleSenegaleseSerbianShoshoneSierra LeoneanSiouxSlavicSlovakSloveneSomaliSouth AfricanSouth AmericanSouth American IndianSoviet UnionSpaniardSpanishSpanish AmericanSpanish American IndianSri LankanSubsaharan AfricanSudaneseSwedishSwissSyrianTaiwaneseThaiTlingit-HaidaTohono O'OdhamTonganTrinidadian and TobagonianTsimshianTurkishU.S. Virgin IslanderUgandanUkrainianUruguayanUteVenezuelanVietnameseWelshWest IndianYakamaYaquiYugoslavianYumanYup'ikZimbabwean
Immigration
NonimmigrantsImmigrantsAfghanistanAfricaAlbaniaArgentinaArmeniaAsiaAustraliaAustriaBahamasBangladeshBarbadosBelarusBelgiumBelizeBoliviaBosnia and HerzegovinaBrazilBulgariaBurma/MyanmarCabo VerdeCambodiaCameroonCanadaCaribbeanCentral AmericaChileChinaColombiaCongoCosta RicaCroatiaCubaCzechoslovakiaDenmarkDominicaDominican RepublicEastern AfricaEastern AsiaEastern EuropeEcuadorEgyptEl SalvadorEnglandEritreaEthiopiaEuropeFijiFranceGermanyGhanaGreeceGrenadaGuatemalaGuyanaHaitiHondurasHong KongHungaryIndiaIndonesiaIranIraqIrelandIsraelItalyJamaicaJapanJordanKazakhstanKenyaKoreaKuwaitLaosLatin AmericaLatviaLebanonLiberiaLithuaniaMalaysiaMexicoMicronesiaMiddle AfricaMoldovaMoroccoNepalNetherlandsNicaraguaNigeriaNorth AmericaNorth MacedoniaNorthern AfricaNorthern EuropeNorwayOceaniaPakistanPanamaPeruPhilippinesPolandPortugalRomaniaRussiaSaudi ArabiaSenegalSerbiaSierra LeoneSingaporeSomaliaSouth AfricaSouth AmericaSouth Central AsiaSouth Eastern AsiaSouthern EuropeSpainSri LankaSt. Vincent and the GrenadinesSudanSwedenSwitzerlandSyriaTaiwanThailandTrinidad and TobagoTurkeyUgandaUkraineUruguayUzbekistanVenezuelaVietnamWest IndiesWestern AfricaWestern AsiaWestern EuropeYemenZaireZimbabweAzores
In Labor Force | Age 20-24
Income
Poverty
Unemployment
Labor Participation
Family Structure
Vehicle Availability
Education Level
Disability

In Labor Force | Age 20-24 Comparison

Immigrants from Scotland

Immigrants from Senegal

Exceptional
Tragic
75.8%
IN LABOR FORCE | AGE 20-24
93.7/ 100
METRIC RATING
125th/ 347
METRIC RANK
74.0%
IN LABOR FORCE | AGE 20-24
2.1/ 100
METRIC RATING
241st/ 347
METRIC RANK

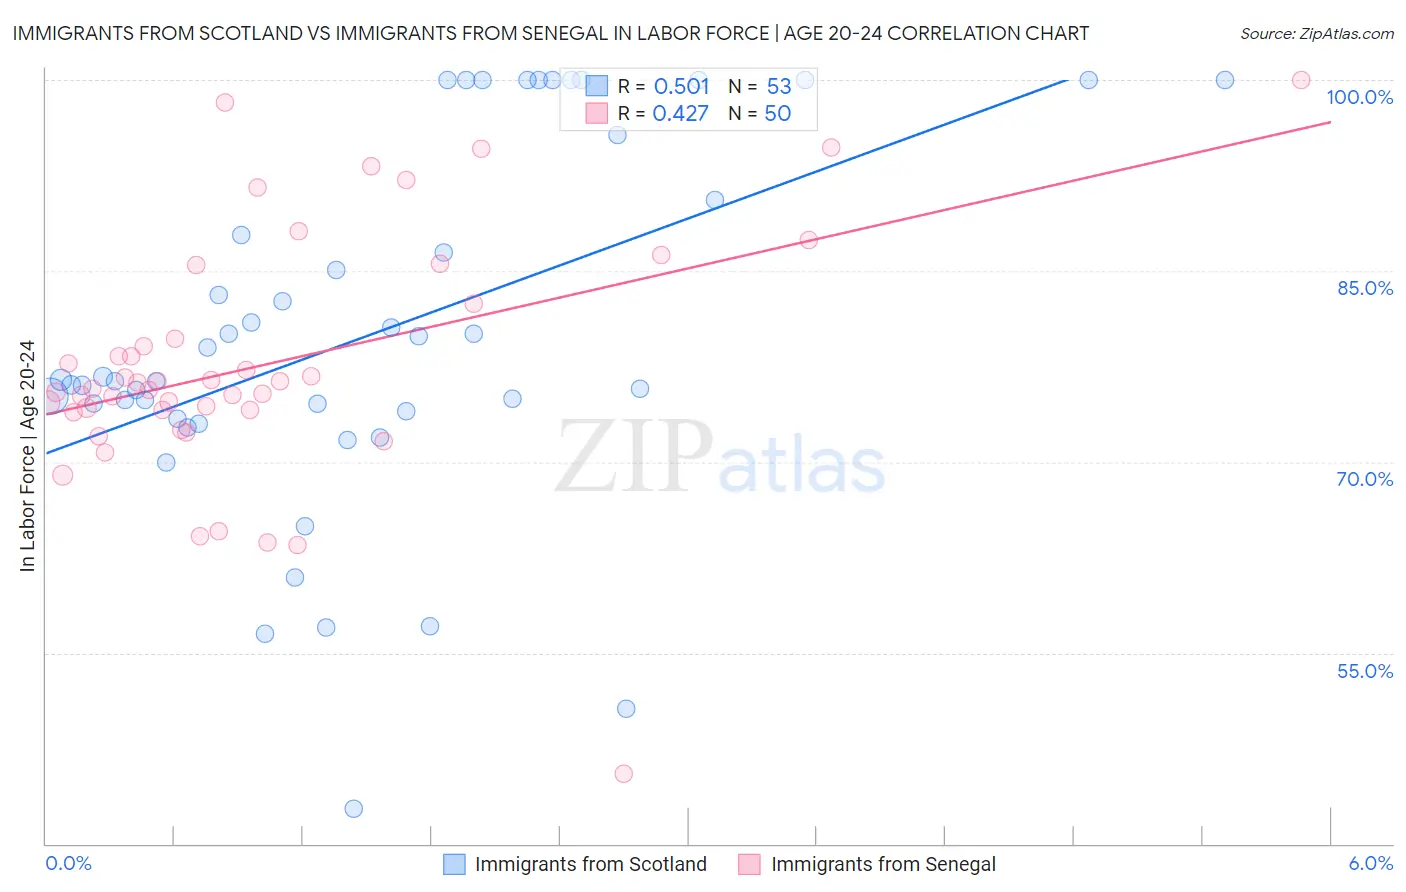
Immigrants from Scotland vs Immigrants from Senegal In Labor Force | Age 20-24 Correlation Chart

The statistical analysis conducted on geographies consisting of 196,345,554 people shows a substantial positive correlation between the proportion of Immigrants from Scotland and labor force participation rate among population between the ages 20 and 24 in the United States with a correlation coefficient (R) of 0.501 and weighted average of 75.8%. Similarly, the statistical analysis conducted on geographies consisting of 90,118,430 people shows a moderate positive correlation between the proportion of Immigrants from Senegal and labor force participation rate among population between the ages 20 and 24 in the United States with a correlation coefficient (R) of 0.427 and weighted average of 74.0%, a difference of 2.4%.
Immigrants from Scotland vs Immigrants from Senegal In Labor Force | Age 20-24

In Labor Force | Age 20-24 Correlation Summary

MeasurementImmigrants from ScotlandImmigrants from Senegal
Minimum42.7%45.5%
Maximum100.0%100.0%
Range57.3%54.5%
Mean80.1%77.7%
Median76.4%76.0%
Interquartile 25% (IQ1)73.7%74.1%
Interquartile 75% (IQ3)93.2%82.4%
Interquartile Range (IQR)19.5%8.3%
Standard Deviation (Sample)14.2%9.8%
Standard Deviation (Population)14.0%9.7%

Similar Demographics by In Labor Force | Age 20-24

Demographics Similar to Immigrants from Scotland by In Labor Force | Age 20-24

In terms of in labor force | age 20-24, the demographic groups most similar to Immigrants from Scotland are Immigrants from Sierra Leone (75.8%, a difference of 0.010%), Pakistani (75.8%, a difference of 0.030%), Immigrants from Bulgaria (75.8%, a difference of 0.030%), Immigrants from Serbia (75.8%, a difference of 0.040%), and Brazilian (75.8%, a difference of 0.040%).
DemographicsRating | RankIn Labor Force | Age 20-24
Spanish Americans
94.8
/100
|
#118
Exceptional
75.8%
Immigrants | Portugal
94.8
/100
|
#119
Exceptional
75.8%
Immigrants | Africa
94.6
/100
|
#120
Exceptional
75.8%
Immigrants | Serbia
94.3
/100
|
#121
Exceptional
75.8%
Pakistanis
94.1
/100
|
#122
Exceptional
75.8%
Immigrants | Bulgaria
94.1
/100
|
#123
Exceptional
75.8%
Immigrants | Sierra Leone
93.8
/100
|
#124
Exceptional
75.8%
Immigrants | Scotland
93.7
/100
|
#125
Exceptional
75.8%
Brazilians
93.0
/100
|
#126
Exceptional
75.8%
Sub-Saharan Africans
90.9
/100
|
#127
Exceptional
75.7%
Immigrants | Afghanistan
89.4
/100
|
#128
Excellent
75.6%
Iroquois
89.1
/100
|
#129
Excellent
75.6%
Immigrants | Austria
88.8
/100
|
#130
Excellent
75.6%
Immigrants | Jordan
88.5
/100
|
#131
Excellent
75.6%
Palestinians
88.4
/100
|
#132
Excellent
75.6%

Demographics Similar to Immigrants from Senegal by In Labor Force | Age 20-24

In terms of in labor force | age 20-24, the demographic groups most similar to Immigrants from Senegal are Thai (74.0%, a difference of 0.010%), Immigrants from Sri Lanka (74.0%, a difference of 0.030%), Immigrants from Syria (74.0%, a difference of 0.040%), Immigrants from South Central Asia (74.0%, a difference of 0.040%), and Turkish (73.9%, a difference of 0.070%).
DemographicsRating | RankIn Labor Force | Age 20-24
Immigrants | Immigrants
3.6
/100
|
#234
Tragic
74.1%
Laotians
3.5
/100
|
#235
Tragic
74.1%
Immigrants | France
3.3
/100
|
#236
Tragic
74.1%
Bermudans
3.2
/100
|
#237
Tragic
74.1%
Immigrants | Japan
3.0
/100
|
#238
Tragic
74.1%
Immigrants | Latin America
2.7
/100
|
#239
Tragic
74.1%
Immigrants | Sri Lanka
2.3
/100
|
#240
Tragic
74.0%
Immigrants | Senegal
2.1
/100
|
#241
Tragic
74.0%
Thais
2.1
/100
|
#242
Tragic
74.0%
Immigrants | Syria
1.9
/100
|
#243
Tragic
74.0%
Immigrants | South Central Asia
1.9
/100
|
#244
Tragic
74.0%
Turks
1.8
/100
|
#245
Tragic
73.9%
Immigrants | Panama
1.6
/100
|
#246
Tragic
73.9%
Colville
1.5
/100
|
#247
Tragic
73.9%
Immigrants | Saudi Arabia
1.5
/100
|
#248
Tragic
73.9%