Tlingit-Haida vs Hawaiian In Labor Force | Age 20-24
COMPARE
Tlingit-Haida
Hawaiian
In Labor Force | Age 20-24
In Labor Force | Age 20-24 Comparison
Tlingit-Haida
Hawaiians
77.9%
IN LABOR FORCE | AGE 20-24
100.0/ 100
METRIC RATING
25th/ 347
METRIC RANK
77.0%
IN LABOR FORCE | AGE 20-24
99.9/ 100
METRIC RATING
58th/ 347
METRIC RANK
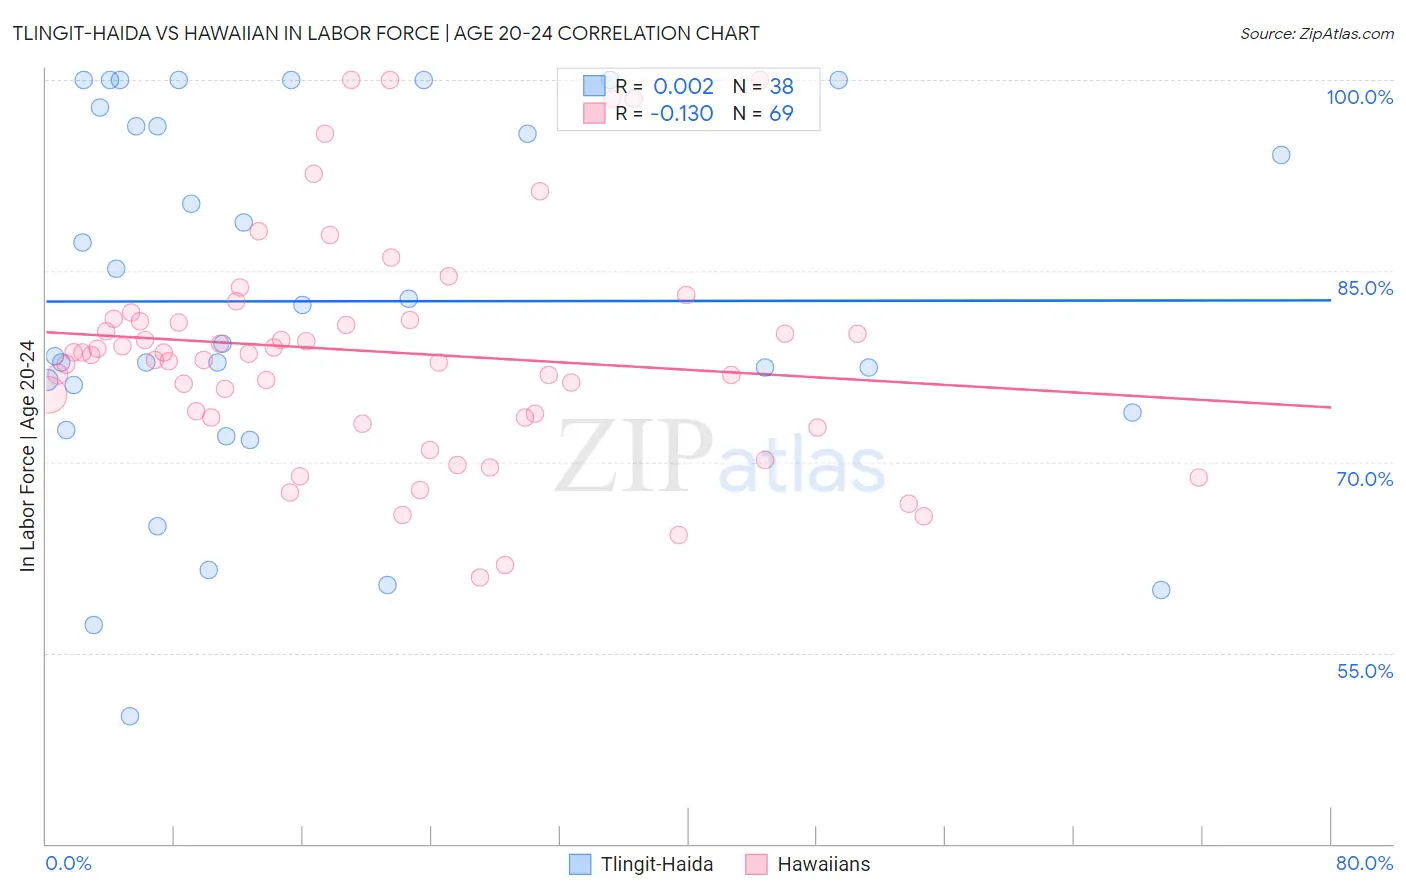
Tlingit-Haida vs Hawaiian In Labor Force | Age 20-24 Correlation Chart
The statistical analysis conducted on geographies consisting of 60,858,700 people shows no correlation between the proportion of Tlingit-Haida and labor force participation rate among population between the ages 20 and 24 in the United States with a correlation coefficient (R) of 0.002 and weighted average of 77.9%. Similarly, the statistical analysis conducted on geographies consisting of 327,479,725 people shows a poor negative correlation between the proportion of Hawaiians and labor force participation rate among population between the ages 20 and 24 in the United States with a correlation coefficient (R) of -0.130 and weighted average of 77.0%, a difference of 1.1%.
In Labor Force | Age 20-24 Correlation Summary
| Measurement | Tlingit-Haida | Hawaiian |
| Minimum | 50.0% | 60.9% |
| Maximum | 100.0% | 100.0% |
| Range | 50.0% | 39.1% |
| Mean | 82.6% | 78.6% |
| Median | 80.8% | 78.5% |
| Interquartile 25% (IQ1) | 73.9% | 73.5% |
| Interquartile 75% (IQ3) | 96.4% | 81.2% |
| Interquartile Range (IQR) | 22.5% | 7.7% |
| Standard Deviation (Sample) | 14.3% | 8.9% |
| Standard Deviation (Population) | 14.1% | 8.8% |
Similar Demographics by In Labor Force | Age 20-24
Demographics Similar to Tlingit-Haida by In Labor Force | Age 20-24
In terms of in labor force | age 20-24, the demographic groups most similar to Tlingit-Haida are Tongan (77.9%, a difference of 0.020%), Yugoslavian (78.0%, a difference of 0.040%), Liberian (78.0%, a difference of 0.040%), Pennsylvania German (78.0%, a difference of 0.050%), and Puget Sound Salish (78.0%, a difference of 0.11%).
| Demographics | Rating | Rank | In Labor Force | Age 20-24 |
| Immigrants | Bosnia and Herzegovina | 100.0 /100 | #18 | Exceptional 78.1% |
| Bangladeshis | 100.0 /100 | #19 | Exceptional 78.1% |
| French Canadians | 100.0 /100 | #20 | Exceptional 78.1% |
| Puget Sound Salish | 100.0 /100 | #21 | Exceptional 78.0% |
| Pennsylvania Germans | 100.0 /100 | #22 | Exceptional 78.0% |
| Yugoslavians | 100.0 /100 | #23 | Exceptional 78.0% |
| Liberians | 100.0 /100 | #24 | Exceptional 78.0% |
| Tlingit-Haida | 100.0 /100 | #25 | Exceptional 77.9% |
| Tongans | 100.0 /100 | #26 | Exceptional 77.9% |
| Immigrants | Micronesia | 100.0 /100 | #27 | Exceptional 77.8% |
| Belgians | 100.0 /100 | #28 | Exceptional 77.8% |
| Slovaks | 100.0 /100 | #29 | Exceptional 77.7% |
| Swiss | 100.0 /100 | #30 | Exceptional 77.7% |
| Poles | 100.0 /100 | #31 | Exceptional 77.6% |
| English | 100.0 /100 | #32 | Exceptional 77.6% |
Demographics Similar to Hawaiians by In Labor Force | Age 20-24
In terms of in labor force | age 20-24, the demographic groups most similar to Hawaiians are Chippewa (77.1%, a difference of 0.020%), Scotch-Irish (77.0%, a difference of 0.030%), Immigrants from Liberia (77.1%, a difference of 0.040%), European (77.1%, a difference of 0.040%), and Celtic (77.1%, a difference of 0.060%).
| Demographics | Rating | Rank | In Labor Force | Age 20-24 |
| Croatians | 100.0 /100 | #51 | Exceptional 77.2% |
| Indonesians | 100.0 /100 | #52 | Exceptional 77.2% |
| Immigrants | Azores | 100.0 /100 | #53 | Exceptional 77.2% |
| Celtics | 99.9 /100 | #54 | Exceptional 77.1% |
| Immigrants | Liberia | 99.9 /100 | #55 | Exceptional 77.1% |
| Europeans | 99.9 /100 | #56 | Exceptional 77.1% |
| Chippewa | 99.9 /100 | #57 | Exceptional 77.1% |
| Hawaiians | 99.9 /100 | #58 | Exceptional 77.0% |
| Scotch-Irish | 99.9 /100 | #59 | Exceptional 77.0% |
| Kenyans | 99.9 /100 | #60 | Exceptional 77.0% |
| Immigrants | Eritrea | 99.9 /100 | #61 | Exceptional 77.0% |
| Immigrants | Kenya | 99.9 /100 | #62 | Exceptional 77.0% |
| Lithuanians | 99.9 /100 | #63 | Exceptional 77.0% |
| Whites/Caucasians | 99.9 /100 | #64 | Exceptional 76.9% |
| Crow | 99.9 /100 | #65 | Exceptional 76.9% |