Tlingit-Haida vs Immigrants from Iraq In Labor Force | Age 20-64
COMPARE
Tlingit-Haida
Immigrants from Iraq
In Labor Force | Age 20-64
In Labor Force | Age 20-64 Comparison
Tlingit-Haida
Immigrants from Iraq
79.0%
IN LABOR FORCE | AGE 20-64
3.2/ 100
METRIC RATING
235th/ 347
METRIC RANK
79.6%
IN LABOR FORCE | AGE 20-64
62.0/ 100
METRIC RATING
167th/ 347
METRIC RANK
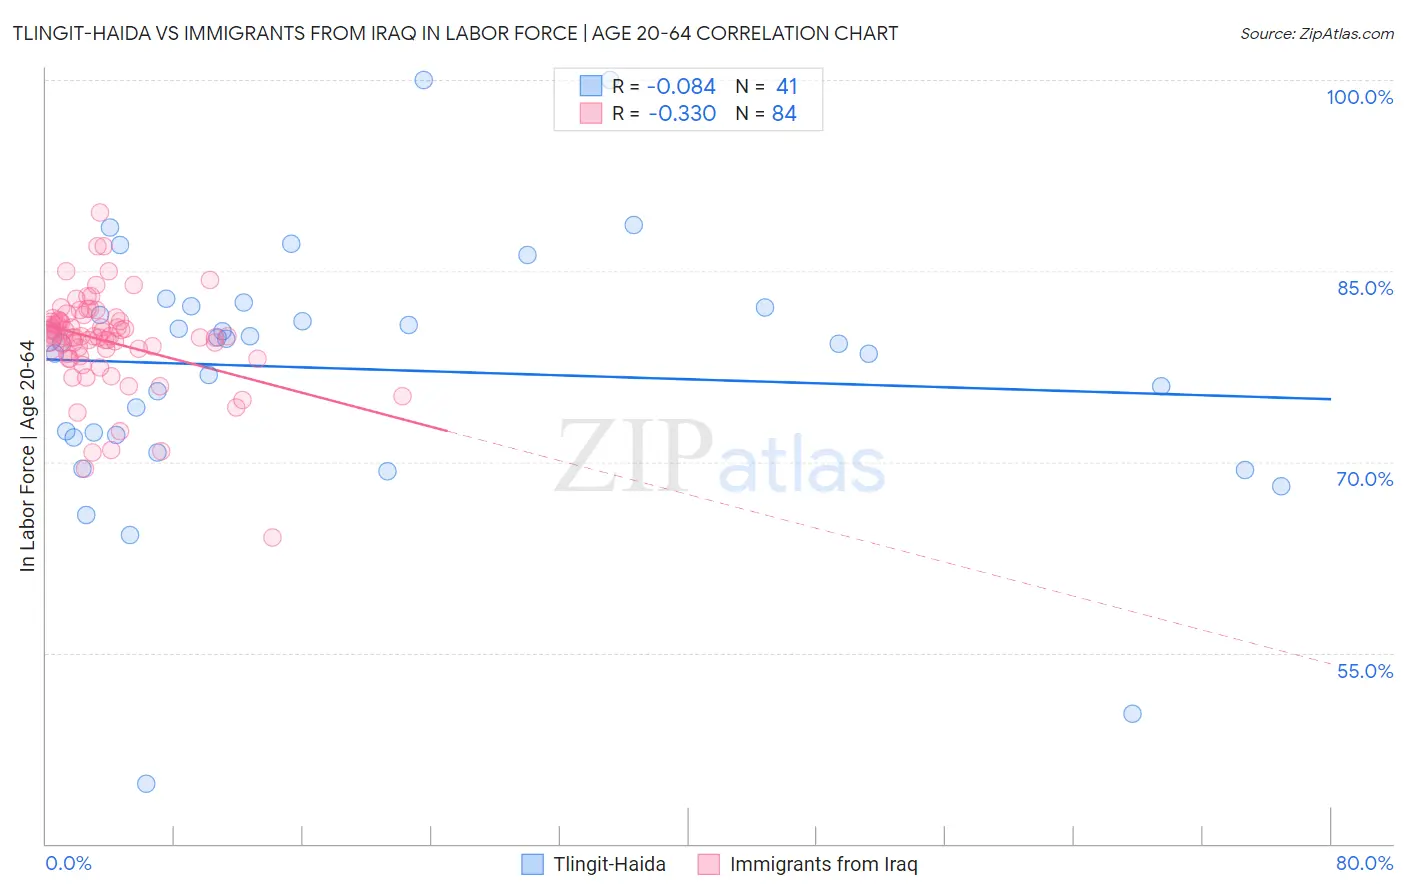
Tlingit-Haida vs Immigrants from Iraq In Labor Force | Age 20-64 Correlation Chart
The statistical analysis conducted on geographies consisting of 60,871,082 people shows a slight negative correlation between the proportion of Tlingit-Haida and labor force participation rate among population between the ages 20 and 64 in the United States with a correlation coefficient (R) of -0.084 and weighted average of 79.0%. Similarly, the statistical analysis conducted on geographies consisting of 194,730,293 people shows a mild negative correlation between the proportion of Immigrants from Iraq and labor force participation rate among population between the ages 20 and 64 in the United States with a correlation coefficient (R) of -0.330 and weighted average of 79.6%, a difference of 0.79%.
In Labor Force | Age 20-64 Correlation Summary
| Measurement | Tlingit-Haida | Immigrants from Iraq |
| Minimum | 44.7% | 64.1% |
| Maximum | 100.0% | 89.6% |
| Range | 55.3% | 25.5% |
| Mean | 77.3% | 79.5% |
| Median | 79.4% | 79.9% |
| Interquartile 25% (IQ1) | 72.0% | 78.4% |
| Interquartile 75% (IQ3) | 82.1% | 81.1% |
| Interquartile Range (IQR) | 10.1% | 2.7% |
| Standard Deviation (Sample) | 10.4% | 3.8% |
| Standard Deviation (Population) | 10.2% | 3.8% |
Similar Demographics by In Labor Force | Age 20-64
Demographics Similar to Tlingit-Haida by In Labor Force | Age 20-64
In terms of in labor force | age 20-64, the demographic groups most similar to Tlingit-Haida are Immigrants from Canada (79.0%, a difference of 0.0%), Samoan (79.0%, a difference of 0.020%), Immigrants from North America (79.0%, a difference of 0.020%), Immigrants from Jamaica (79.0%, a difference of 0.040%), and Japanese (79.1%, a difference of 0.050%).
| Demographics | Rating | Rank | In Labor Force | Age 20-64 |
| Panamanians | 5.7 /100 | #228 | Tragic 79.1% |
| Alsatians | 5.7 /100 | #229 | Tragic 79.1% |
| Native Hawaiians | 5.6 /100 | #230 | Tragic 79.1% |
| Lebanese | 5.1 /100 | #231 | Tragic 79.1% |
| Guamanians/Chamorros | 4.5 /100 | #232 | Tragic 79.1% |
| Japanese | 4.0 /100 | #233 | Tragic 79.1% |
| Immigrants | Canada | 3.2 /100 | #234 | Tragic 79.0% |
| Tlingit-Haida | 3.2 /100 | #235 | Tragic 79.0% |
| Samoans | 2.9 /100 | #236 | Tragic 79.0% |
| Immigrants | North America | 2.9 /100 | #237 | Tragic 79.0% |
| Immigrants | Jamaica | 2.6 /100 | #238 | Tragic 79.0% |
| Welsh | 2.4 /100 | #239 | Tragic 79.0% |
| Trinidadians and Tobagonians | 2.3 /100 | #240 | Tragic 79.0% |
| Jamaicans | 2.0 /100 | #241 | Tragic 78.9% |
| Immigrants | Micronesia | 1.9 /100 | #242 | Tragic 78.9% |
Demographics Similar to Immigrants from Iraq by In Labor Force | Age 20-64
In terms of in labor force | age 20-64, the demographic groups most similar to Immigrants from Iraq are Immigrants from Indonesia (79.6%, a difference of 0.0%), Okinawan (79.6%, a difference of 0.010%), Immigrants from Costa Rica (79.7%, a difference of 0.020%), Immigrants from Burma/Myanmar (79.7%, a difference of 0.020%), and Nigerian (79.7%, a difference of 0.020%).
| Demographics | Rating | Rank | In Labor Force | Age 20-64 |
| Moroccans | 66.7 /100 | #160 | Good 79.7% |
| South Africans | 66.2 /100 | #161 | Good 79.7% |
| Germans | 65.2 /100 | #162 | Good 79.7% |
| Immigrants | Costa Rica | 64.6 /100 | #163 | Good 79.7% |
| Immigrants | Burma/Myanmar | 64.4 /100 | #164 | Good 79.7% |
| Nigerians | 64.0 /100 | #165 | Good 79.7% |
| Okinawans | 62.7 /100 | #166 | Good 79.6% |
| Immigrants | Iraq | 62.0 /100 | #167 | Good 79.6% |
| Immigrants | Indonesia | 61.8 /100 | #168 | Good 79.6% |
| Laotians | 58.4 /100 | #169 | Average 79.6% |
| Slavs | 54.0 /100 | #170 | Average 79.6% |
| Immigrants | Switzerland | 53.3 /100 | #171 | Average 79.6% |
| Immigrants | Belgium | 53.1 /100 | #172 | Average 79.6% |
| Immigrants | Scotland | 52.4 /100 | #173 | Average 79.6% |
| Syrians | 50.0 /100 | #174 | Average 79.6% |