Tlingit-Haida vs Immigrants from Iraq Unemployment Among Ages 45 to 54 years
COMPARE
Tlingit-Haida
Immigrants from Iraq
Unemployment Among Ages 45 to 54 years
Unemployment Among Ages 45 to 54 years Comparison
Tlingit-Haida
Immigrants from Iraq
4.7%
UNEMPLOYMENT AMONG AGES 45 TO 54 YEARS
2.3/ 100
METRIC RATING
236th/ 347
METRIC RANK
4.7%
UNEMPLOYMENT AMONG AGES 45 TO 54 YEARS
1.3/ 100
METRIC RATING
240th/ 347
METRIC RANK
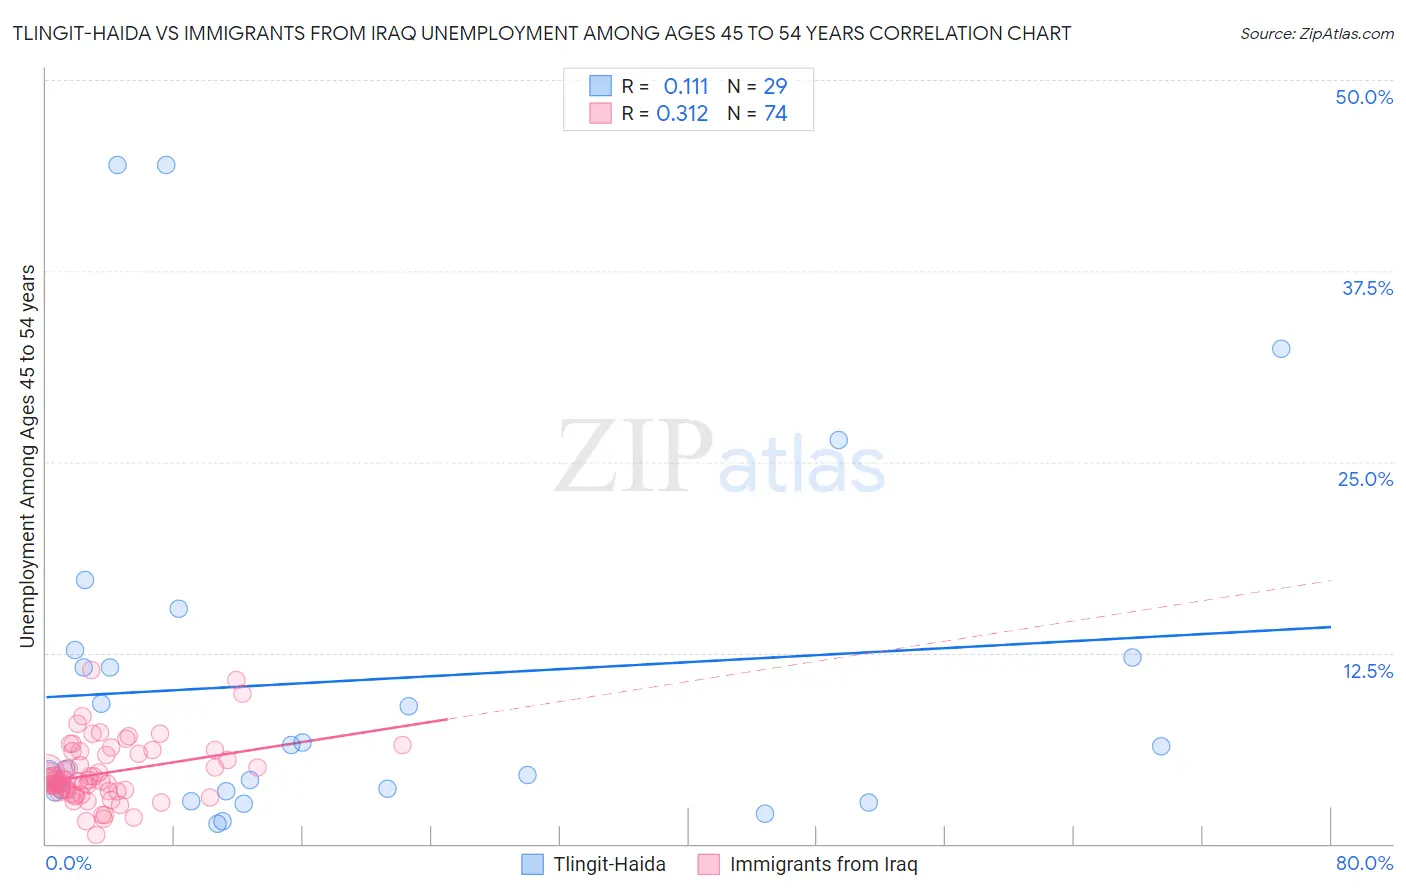
Tlingit-Haida vs Immigrants from Iraq Unemployment Among Ages 45 to 54 years Correlation Chart
The statistical analysis conducted on geographies consisting of 60,127,685 people shows a poor positive correlation between the proportion of Tlingit-Haida and unemployment rate among population between the ages 45 and 54 in the United States with a correlation coefficient (R) of 0.111 and weighted average of 4.7%. Similarly, the statistical analysis conducted on geographies consisting of 192,988,418 people shows a mild positive correlation between the proportion of Immigrants from Iraq and unemployment rate among population between the ages 45 and 54 in the United States with a correlation coefficient (R) of 0.312 and weighted average of 4.7%, a difference of 0.59%.
Unemployment Among Ages 45 to 54 years Correlation Summary
| Measurement | Tlingit-Haida | Immigrants from Iraq |
| Minimum | 1.3% | 0.60% |
| Maximum | 44.4% | 11.4% |
| Range | 43.1% | 10.8% |
| Mean | 10.7% | 4.6% |
| Median | 6.4% | 4.2% |
| Interquartile 25% (IQ1) | 3.4% | 3.4% |
| Interquartile 75% (IQ3) | 12.4% | 5.9% |
| Interquartile Range (IQR) | 9.0% | 2.5% |
| Standard Deviation (Sample) | 11.8% | 2.0% |
| Standard Deviation (Population) | 11.6% | 2.0% |
Demographics Similar to Tlingit-Haida and Immigrants from Iraq by Unemployment Among Ages 45 to 54 years
In terms of unemployment among ages 45 to 54 years, the demographic groups most similar to Tlingit-Haida are Cree (4.7%, a difference of 0.010%), Soviet Union (4.7%, a difference of 0.16%), Immigrants (4.7%, a difference of 0.18%), Ottawa (4.7%, a difference of 0.21%), and Immigrants from Ireland (4.7%, a difference of 0.22%). Similarly, the demographic groups most similar to Immigrants from Iraq are Yaqui (4.7%, a difference of 0.030%), Spanish American (4.7%, a difference of 0.030%), Delaware (4.8%, a difference of 0.070%), Central American (4.8%, a difference of 0.070%), and Portuguese (4.8%, a difference of 0.19%).
| Demographics | Rating | Rank | Unemployment Among Ages 45 to 54 years |
| South American Indians | 3.1 /100 | #228 | Tragic 4.7% |
| Immigrants | Israel | 3.0 /100 | #229 | Tragic 4.7% |
| Japanese | 2.8 /100 | #230 | Tragic 4.7% |
| Immigrants | Ireland | 2.7 /100 | #231 | Tragic 4.7% |
| Ottawa | 2.7 /100 | #232 | Tragic 4.7% |
| Immigrants | Immigrants | 2.6 /100 | #233 | Tragic 4.7% |
| Soviet Union | 2.6 /100 | #234 | Tragic 4.7% |
| Cree | 2.3 /100 | #235 | Tragic 4.7% |
| Tlingit-Haida | 2.3 /100 | #236 | Tragic 4.7% |
| Alsatians | 1.6 /100 | #237 | Tragic 4.7% |
| Yaqui | 1.4 /100 | #238 | Tragic 4.7% |
| Spanish Americans | 1.4 /100 | #239 | Tragic 4.7% |
| Immigrants | Iraq | 1.3 /100 | #240 | Tragic 4.7% |
| Delaware | 1.3 /100 | #241 | Tragic 4.8% |
| Central Americans | 1.3 /100 | #242 | Tragic 4.8% |
| Portuguese | 1.1 /100 | #243 | Tragic 4.8% |
| Seminole | 1.1 /100 | #244 | Tragic 4.8% |
| Immigrants | Albania | 0.9 /100 | #245 | Tragic 4.8% |
| Immigrants | Syria | 0.9 /100 | #246 | Tragic 4.8% |
| Israelis | 0.9 /100 | #247 | Tragic 4.8% |
| Immigrants | Liberia | 0.8 /100 | #248 | Tragic 4.8% |