Tlingit-Haida vs Immigrants from Iraq In Labor Force | Age 30-34
COMPARE
Tlingit-Haida
Immigrants from Iraq
In Labor Force | Age 30-34
In Labor Force | Age 30-34 Comparison
Tlingit-Haida
Immigrants from Iraq
82.3%
IN LABOR FORCE | AGE 30-34
0.0/ 100
METRIC RATING
304th/ 347
METRIC RANK
83.9%
IN LABOR FORCE | AGE 30-34
0.7/ 100
METRIC RATING
250th/ 347
METRIC RANK
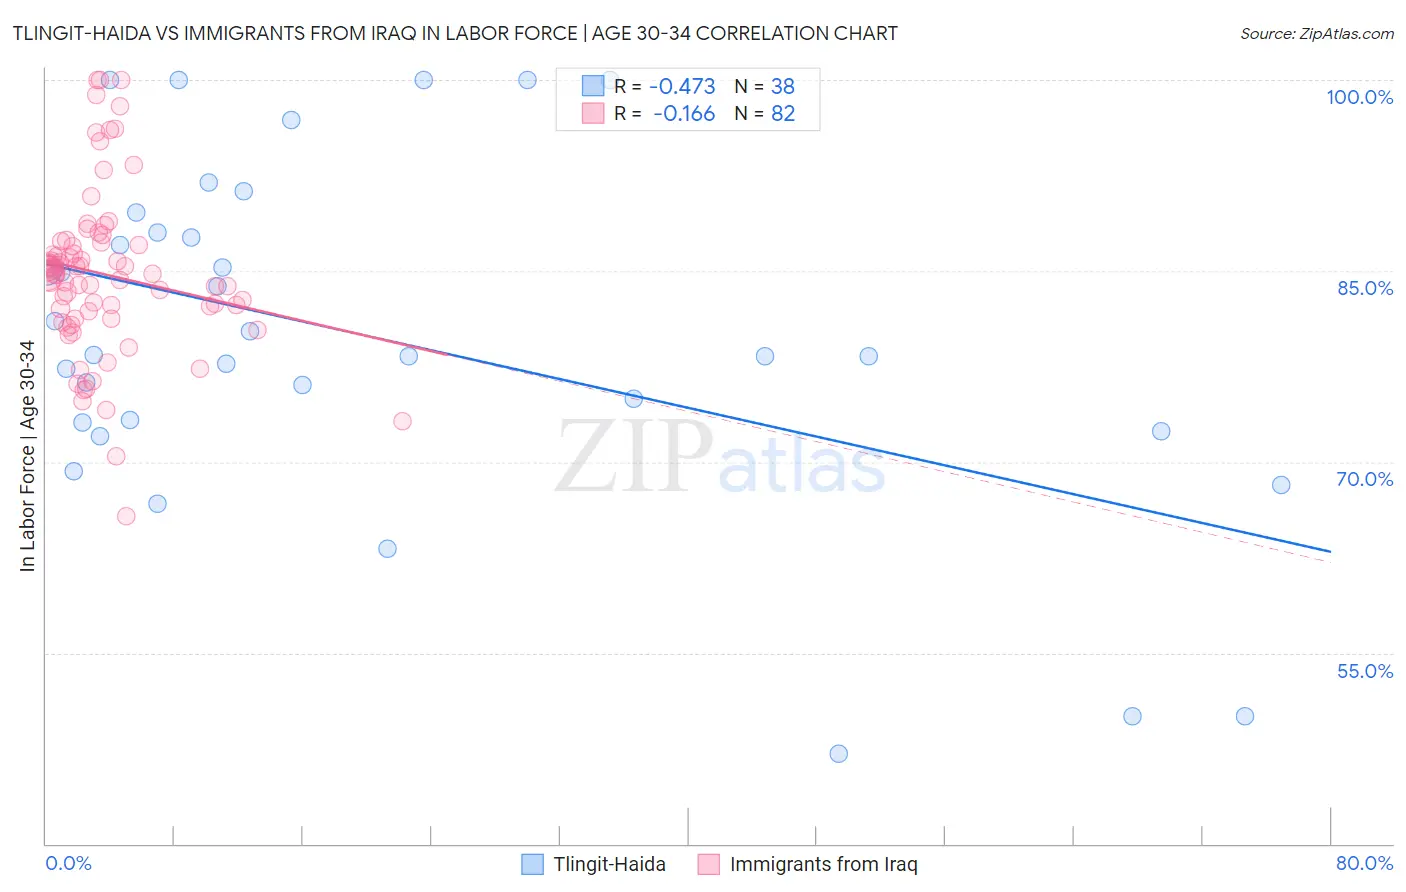
Tlingit-Haida vs Immigrants from Iraq In Labor Force | Age 30-34 Correlation Chart
The statistical analysis conducted on geographies consisting of 60,864,119 people shows a moderate negative correlation between the proportion of Tlingit-Haida and labor force participation rate among population between the ages 30 and 34 in the United States with a correlation coefficient (R) of -0.473 and weighted average of 82.3%. Similarly, the statistical analysis conducted on geographies consisting of 194,759,411 people shows a poor negative correlation between the proportion of Immigrants from Iraq and labor force participation rate among population between the ages 30 and 34 in the United States with a correlation coefficient (R) of -0.166 and weighted average of 83.9%, a difference of 2.0%.
In Labor Force | Age 30-34 Correlation Summary
| Measurement | Tlingit-Haida | Immigrants from Iraq |
| Minimum | 47.1% | 65.7% |
| Maximum | 100.0% | 100.0% |
| Range | 52.9% | 34.3% |
| Mean | 79.8% | 84.7% |
| Median | 78.3% | 84.8% |
| Interquartile 25% (IQ1) | 73.1% | 81.2% |
| Interquartile 75% (IQ3) | 88.0% | 87.3% |
| Interquartile Range (IQR) | 14.9% | 6.0% |
| Standard Deviation (Sample) | 13.6% | 6.6% |
| Standard Deviation (Population) | 13.4% | 6.5% |
Similar Demographics by In Labor Force | Age 30-34
Demographics Similar to Tlingit-Haida by In Labor Force | Age 30-34
In terms of in labor force | age 30-34, the demographic groups most similar to Tlingit-Haida are Immigrants from Micronesia (82.4%, a difference of 0.080%), Osage (82.3%, a difference of 0.080%), Ottawa (82.4%, a difference of 0.090%), Spanish American Indian (82.2%, a difference of 0.090%), and Hispanic or Latino (82.4%, a difference of 0.12%).
| Demographics | Rating | Rank | In Labor Force | Age 30-34 |
| Comanche | 0.0 /100 | #297 | Tragic 82.6% |
| Aleuts | 0.0 /100 | #298 | Tragic 82.6% |
| Immigrants | Central America | 0.0 /100 | #299 | Tragic 82.5% |
| Hmong | 0.0 /100 | #300 | Tragic 82.4% |
| Hispanics or Latinos | 0.0 /100 | #301 | Tragic 82.4% |
| Ottawa | 0.0 /100 | #302 | Tragic 82.4% |
| Immigrants | Micronesia | 0.0 /100 | #303 | Tragic 82.4% |
| Tlingit-Haida | 0.0 /100 | #304 | Tragic 82.3% |
| Osage | 0.0 /100 | #305 | Tragic 82.3% |
| Spanish American Indians | 0.0 /100 | #306 | Tragic 82.2% |
| Menominee | 0.0 /100 | #307 | Tragic 82.2% |
| Puget Sound Salish | 0.0 /100 | #308 | Tragic 82.1% |
| Immigrants | Mexico | 0.0 /100 | #309 | Tragic 82.0% |
| Cajuns | 0.0 /100 | #310 | Tragic 82.0% |
| Chickasaw | 0.0 /100 | #311 | Tragic 81.9% |
Demographics Similar to Immigrants from Iraq by In Labor Force | Age 30-34
In terms of in labor force | age 30-34, the demographic groups most similar to Immigrants from Iraq are Portuguese (84.0%, a difference of 0.020%), Immigrants from Dominica (84.0%, a difference of 0.020%), Nicaraguan (83.9%, a difference of 0.020%), Bahamian (83.9%, a difference of 0.020%), and Immigrants from Nicaragua (83.9%, a difference of 0.020%).
| Demographics | Rating | Rank | In Labor Force | Age 30-34 |
| Immigrants | Caribbean | 1.1 /100 | #243 | Tragic 84.0% |
| Basques | 0.9 /100 | #244 | Tragic 84.0% |
| Immigrants | Venezuela | 0.9 /100 | #245 | Tragic 84.0% |
| Central Americans | 0.9 /100 | #246 | Tragic 84.0% |
| British West Indians | 0.8 /100 | #247 | Tragic 84.0% |
| Portuguese | 0.8 /100 | #248 | Tragic 84.0% |
| Immigrants | Dominica | 0.7 /100 | #249 | Tragic 84.0% |
| Immigrants | Iraq | 0.7 /100 | #250 | Tragic 83.9% |
| Nicaraguans | 0.6 /100 | #251 | Tragic 83.9% |
| Bahamians | 0.6 /100 | #252 | Tragic 83.9% |
| Immigrants | Nicaragua | 0.6 /100 | #253 | Tragic 83.9% |
| Immigrants | St. Vincent and the Grenadines | 0.5 /100 | #254 | Tragic 83.9% |
| Whites/Caucasians | 0.5 /100 | #255 | Tragic 83.9% |
| Immigrants | Lebanon | 0.4 /100 | #256 | Tragic 83.9% |
| Iraqis | 0.3 /100 | #257 | Tragic 83.8% |