Immigrants from Greece vs Immigrants from Iraq In Labor Force | Age 20-64
COMPARE
Immigrants from Greece
Immigrants from Iraq
In Labor Force | Age 20-64
In Labor Force | Age 20-64 Comparison
Immigrants from Greece
Immigrants from Iraq
80.4%
IN LABOR FORCE | AGE 20-64
99.4/ 100
METRIC RATING
49th/ 347
METRIC RANK
79.6%
IN LABOR FORCE | AGE 20-64
62.0/ 100
METRIC RATING
167th/ 347
METRIC RANK
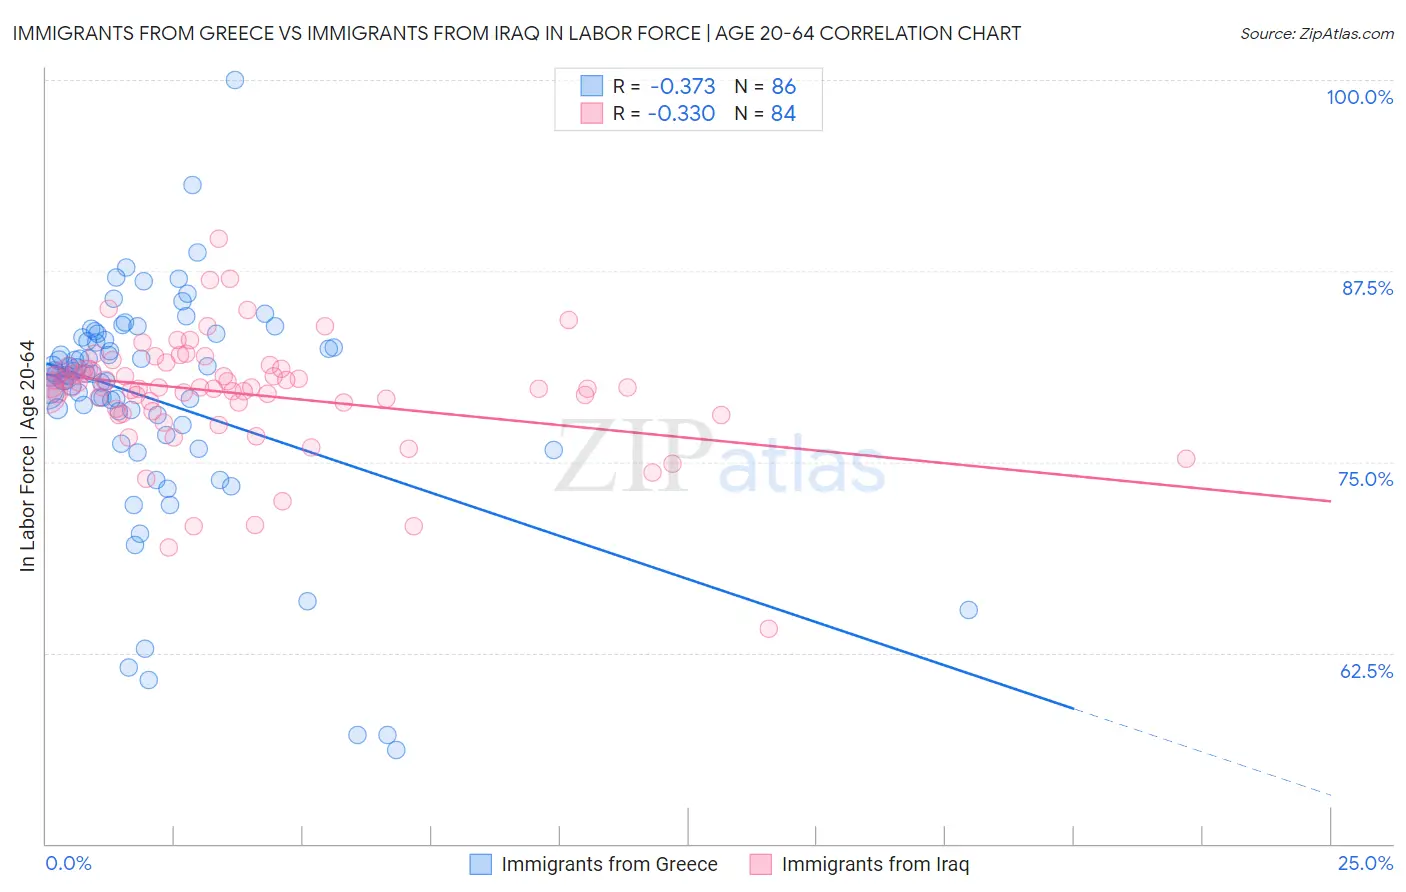
Immigrants from Greece vs Immigrants from Iraq In Labor Force | Age 20-64 Correlation Chart
The statistical analysis conducted on geographies consisting of 216,878,258 people shows a mild negative correlation between the proportion of Immigrants from Greece and labor force participation rate among population between the ages 20 and 64 in the United States with a correlation coefficient (R) of -0.373 and weighted average of 80.4%. Similarly, the statistical analysis conducted on geographies consisting of 194,730,293 people shows a mild negative correlation between the proportion of Immigrants from Iraq and labor force participation rate among population between the ages 20 and 64 in the United States with a correlation coefficient (R) of -0.330 and weighted average of 79.6%, a difference of 0.94%.
In Labor Force | Age 20-64 Correlation Summary
| Measurement | Immigrants from Greece | Immigrants from Iraq |
| Minimum | 56.1% | 64.1% |
| Maximum | 100.0% | 89.6% |
| Range | 43.9% | 25.5% |
| Mean | 79.1% | 79.5% |
| Median | 80.7% | 79.9% |
| Interquartile 25% (IQ1) | 77.4% | 78.4% |
| Interquartile 75% (IQ3) | 83.0% | 81.1% |
| Interquartile Range (IQR) | 5.6% | 2.7% |
| Standard Deviation (Sample) | 7.5% | 3.8% |
| Standard Deviation (Population) | 7.4% | 3.8% |
Similar Demographics by In Labor Force | Age 20-64
Demographics Similar to Immigrants from Greece by In Labor Force | Age 20-64
In terms of in labor force | age 20-64, the demographic groups most similar to Immigrants from Greece are Immigrants from Sudan (80.4%, a difference of 0.020%), Immigrants from Hong Kong (80.4%, a difference of 0.040%), Immigrants from Sri Lanka (80.4%, a difference of 0.040%), Immigrants from Africa (80.4%, a difference of 0.060%), and Turkish (80.3%, a difference of 0.060%).
| Demographics | Rating | Rank | In Labor Force | Age 20-64 |
| Latvians | 99.8 /100 | #42 | Exceptional 80.5% |
| Czechs | 99.7 /100 | #43 | Exceptional 80.5% |
| Immigrants | Middle Africa | 99.7 /100 | #44 | Exceptional 80.5% |
| Slovenes | 99.7 /100 | #45 | Exceptional 80.5% |
| Immigrants | Pakistan | 99.6 /100 | #46 | Exceptional 80.5% |
| Immigrants | Africa | 99.6 /100 | #47 | Exceptional 80.4% |
| Immigrants | Hong Kong | 99.5 /100 | #48 | Exceptional 80.4% |
| Immigrants | Greece | 99.4 /100 | #49 | Exceptional 80.4% |
| Immigrants | Sudan | 99.4 /100 | #50 | Exceptional 80.4% |
| Immigrants | Sri Lanka | 99.3 /100 | #51 | Exceptional 80.4% |
| Turks | 99.2 /100 | #52 | Exceptional 80.3% |
| Immigrants | Peru | 99.2 /100 | #53 | Exceptional 80.3% |
| Peruvians | 99.1 /100 | #54 | Exceptional 80.3% |
| Immigrants | Cabo Verde | 99.0 /100 | #55 | Exceptional 80.3% |
| Immigrants | Northern Africa | 99.0 /100 | #56 | Exceptional 80.3% |
Demographics Similar to Immigrants from Iraq by In Labor Force | Age 20-64
In terms of in labor force | age 20-64, the demographic groups most similar to Immigrants from Iraq are Immigrants from Indonesia (79.6%, a difference of 0.0%), Okinawan (79.6%, a difference of 0.010%), Immigrants from Costa Rica (79.7%, a difference of 0.020%), Immigrants from Burma/Myanmar (79.7%, a difference of 0.020%), and Nigerian (79.7%, a difference of 0.020%).
| Demographics | Rating | Rank | In Labor Force | Age 20-64 |
| Moroccans | 66.7 /100 | #160 | Good 79.7% |
| South Africans | 66.2 /100 | #161 | Good 79.7% |
| Germans | 65.2 /100 | #162 | Good 79.7% |
| Immigrants | Costa Rica | 64.6 /100 | #163 | Good 79.7% |
| Immigrants | Burma/Myanmar | 64.4 /100 | #164 | Good 79.7% |
| Nigerians | 64.0 /100 | #165 | Good 79.7% |
| Okinawans | 62.7 /100 | #166 | Good 79.6% |
| Immigrants | Iraq | 62.0 /100 | #167 | Good 79.6% |
| Immigrants | Indonesia | 61.8 /100 | #168 | Good 79.6% |
| Laotians | 58.4 /100 | #169 | Average 79.6% |
| Slavs | 54.0 /100 | #170 | Average 79.6% |
| Immigrants | Switzerland | 53.3 /100 | #171 | Average 79.6% |
| Immigrants | Belgium | 53.1 /100 | #172 | Average 79.6% |
| Immigrants | Scotland | 52.4 /100 | #173 | Average 79.6% |
| Syrians | 50.0 /100 | #174 | Average 79.6% |