Subsaharan African vs New Zealander In Labor Force | Age 25-29
COMPARE
Subsaharan African
New Zealander
In Labor Force | Age 25-29
In Labor Force | Age 25-29 Comparison
Sub-Saharan Africans
New Zealanders
84.3%
IN LABOR FORCE | AGE 25-29
11.7/ 100
METRIC RATING
212th/ 347
METRIC RANK
85.0%
IN LABOR FORCE | AGE 25-29
91.5/ 100
METRIC RATING
110th/ 347
METRIC RANK
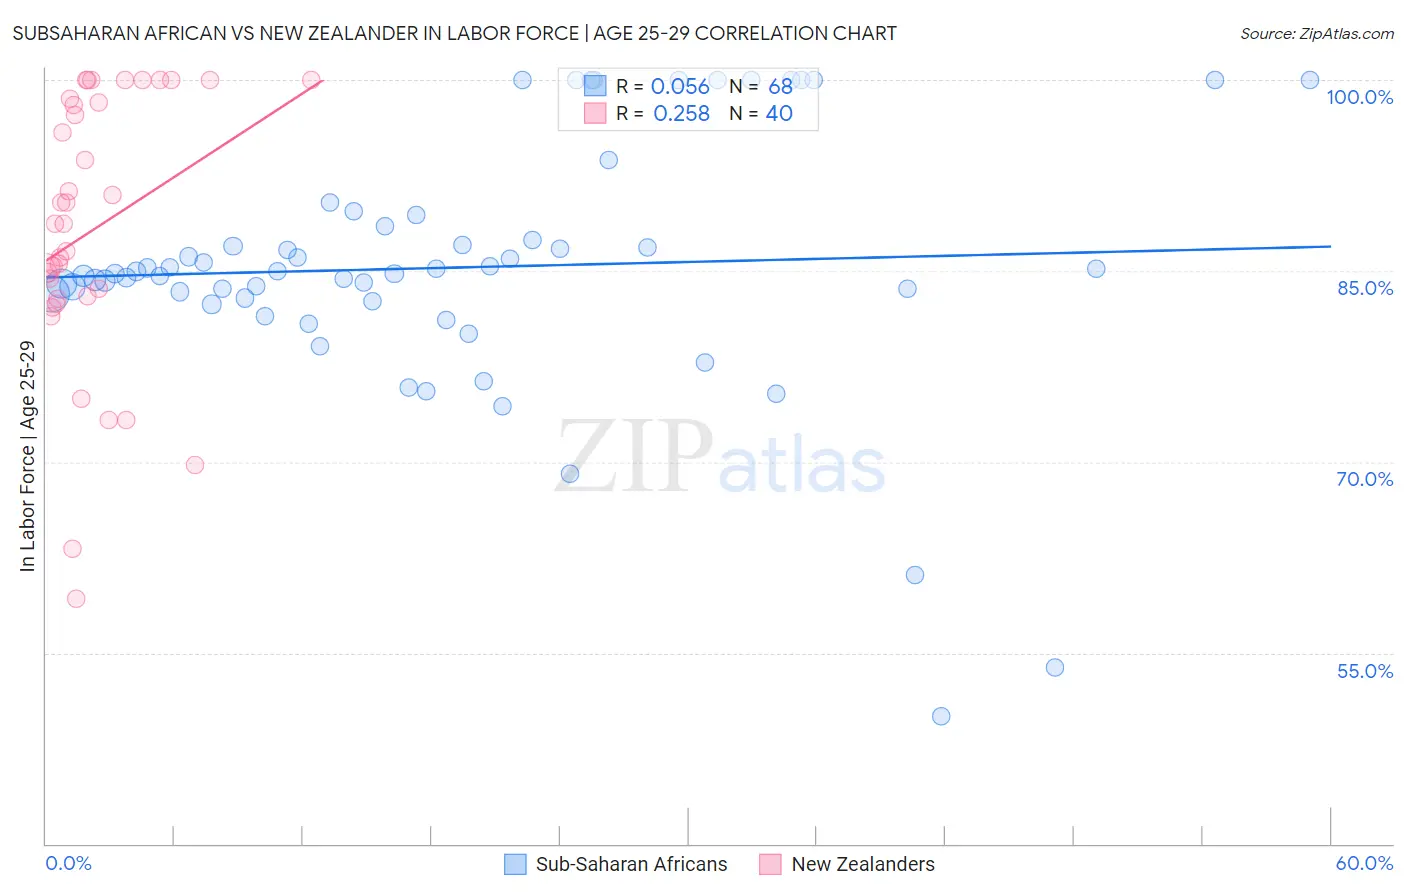
Subsaharan African vs New Zealander In Labor Force | Age 25-29 Correlation Chart
The statistical analysis conducted on geographies consisting of 507,839,893 people shows a slight positive correlation between the proportion of Sub-Saharan Africans and labor force participation rate among population between the ages 25 and 29 in the United States with a correlation coefficient (R) of 0.056 and weighted average of 84.3%. Similarly, the statistical analysis conducted on geographies consisting of 106,898,789 people shows a weak positive correlation between the proportion of New Zealanders and labor force participation rate among population between the ages 25 and 29 in the United States with a correlation coefficient (R) of 0.258 and weighted average of 85.0%, a difference of 0.81%.
In Labor Force | Age 25-29 Correlation Summary
| Measurement | Subsaharan African | New Zealander |
| Minimum | 50.0% | 59.3% |
| Maximum | 100.0% | 100.0% |
| Range | 50.0% | 40.7% |
| Mean | 85.3% | 88.2% |
| Median | 84.9% | 88.7% |
| Interquartile 25% (IQ1) | 82.7% | 82.9% |
| Interquartile 75% (IQ3) | 88.0% | 98.4% |
| Interquartile Range (IQR) | 5.2% | 15.5% |
| Standard Deviation (Sample) | 9.9% | 10.6% |
| Standard Deviation (Population) | 9.8% | 10.5% |
Similar Demographics by In Labor Force | Age 25-29
Demographics Similar to Sub-Saharan Africans by In Labor Force | Age 25-29
In terms of in labor force | age 25-29, the demographic groups most similar to Sub-Saharan Africans are Japanese (84.3%, a difference of 0.0%), Lebanese (84.3%, a difference of 0.010%), Immigrants from Jordan (84.4%, a difference of 0.020%), Chinese (84.3%, a difference of 0.020%), and Immigrants from Venezuela (84.3%, a difference of 0.020%).
| Demographics | Rating | Rank | In Labor Force | Age 25-29 |
| Ecuadorians | 14.8 /100 | #205 | Poor 84.4% |
| Immigrants | Cambodia | 14.3 /100 | #206 | Poor 84.4% |
| Immigrants | Armenia | 13.3 /100 | #207 | Poor 84.4% |
| Immigrants | Indonesia | 13.2 /100 | #208 | Poor 84.4% |
| Immigrants | Jordan | 12.8 /100 | #209 | Poor 84.4% |
| Chinese | 12.7 /100 | #210 | Poor 84.3% |
| Immigrants | Venezuela | 12.6 /100 | #211 | Poor 84.3% |
| Sub-Saharan Africans | 11.7 /100 | #212 | Poor 84.3% |
| Japanese | 11.4 /100 | #213 | Poor 84.3% |
| Lebanese | 11.1 /100 | #214 | Poor 84.3% |
| Immigrants | Syria | 10.7 /100 | #215 | Poor 84.3% |
| Israelis | 9.3 /100 | #216 | Tragic 84.3% |
| Immigrants | Ecuador | 9.3 /100 | #217 | Tragic 84.3% |
| Immigrants | Nigeria | 9.0 /100 | #218 | Tragic 84.3% |
| Immigrants | Saudi Arabia | 8.8 /100 | #219 | Tragic 84.3% |
Demographics Similar to New Zealanders by In Labor Force | Age 25-29
In terms of in labor force | age 25-29, the demographic groups most similar to New Zealanders are Immigrants from Middle Africa (85.0%, a difference of 0.0%), Immigrants from Austria (85.0%, a difference of 0.010%), Costa Rican (85.0%, a difference of 0.010%), Senegalese (85.0%, a difference of 0.010%), and Immigrants from Southern Europe (85.0%, a difference of 0.020%).
| Demographics | Rating | Rank | In Labor Force | Age 25-29 |
| Immigrants | Japan | 93.5 /100 | #103 | Exceptional 85.1% |
| Immigrants | Zaire | 93.3 /100 | #104 | Exceptional 85.1% |
| Immigrants | Hong Kong | 92.8 /100 | #105 | Exceptional 85.0% |
| Czechoslovakians | 92.6 /100 | #106 | Exceptional 85.0% |
| Immigrants | Southern Europe | 92.3 /100 | #107 | Exceptional 85.0% |
| Immigrants | Austria | 91.9 /100 | #108 | Exceptional 85.0% |
| Costa Ricans | 91.9 /100 | #109 | Exceptional 85.0% |
| New Zealanders | 91.5 /100 | #110 | Exceptional 85.0% |
| Immigrants | Middle Africa | 91.4 /100 | #111 | Exceptional 85.0% |
| Senegalese | 90.9 /100 | #112 | Exceptional 85.0% |
| Irish | 90.6 /100 | #113 | Exceptional 85.0% |
| Immigrants | Malaysia | 90.4 /100 | #114 | Exceptional 85.0% |
| South Africans | 88.9 /100 | #115 | Excellent 85.0% |
| Chileans | 88.8 /100 | #116 | Excellent 85.0% |
| Immigrants | Belarus | 88.0 /100 | #117 | Excellent 85.0% |