Subsaharan African vs Spaniard In Labor Force | Age 25-29
COMPARE
Subsaharan African
Spaniard
In Labor Force | Age 25-29
In Labor Force | Age 25-29 Comparison
Sub-Saharan Africans
Spaniards
84.3%
IN LABOR FORCE | AGE 25-29
11.7/ 100
METRIC RATING
212th/ 347
METRIC RANK
83.7%
IN LABOR FORCE | AGE 25-29
0.2/ 100
METRIC RATING
254th/ 347
METRIC RANK
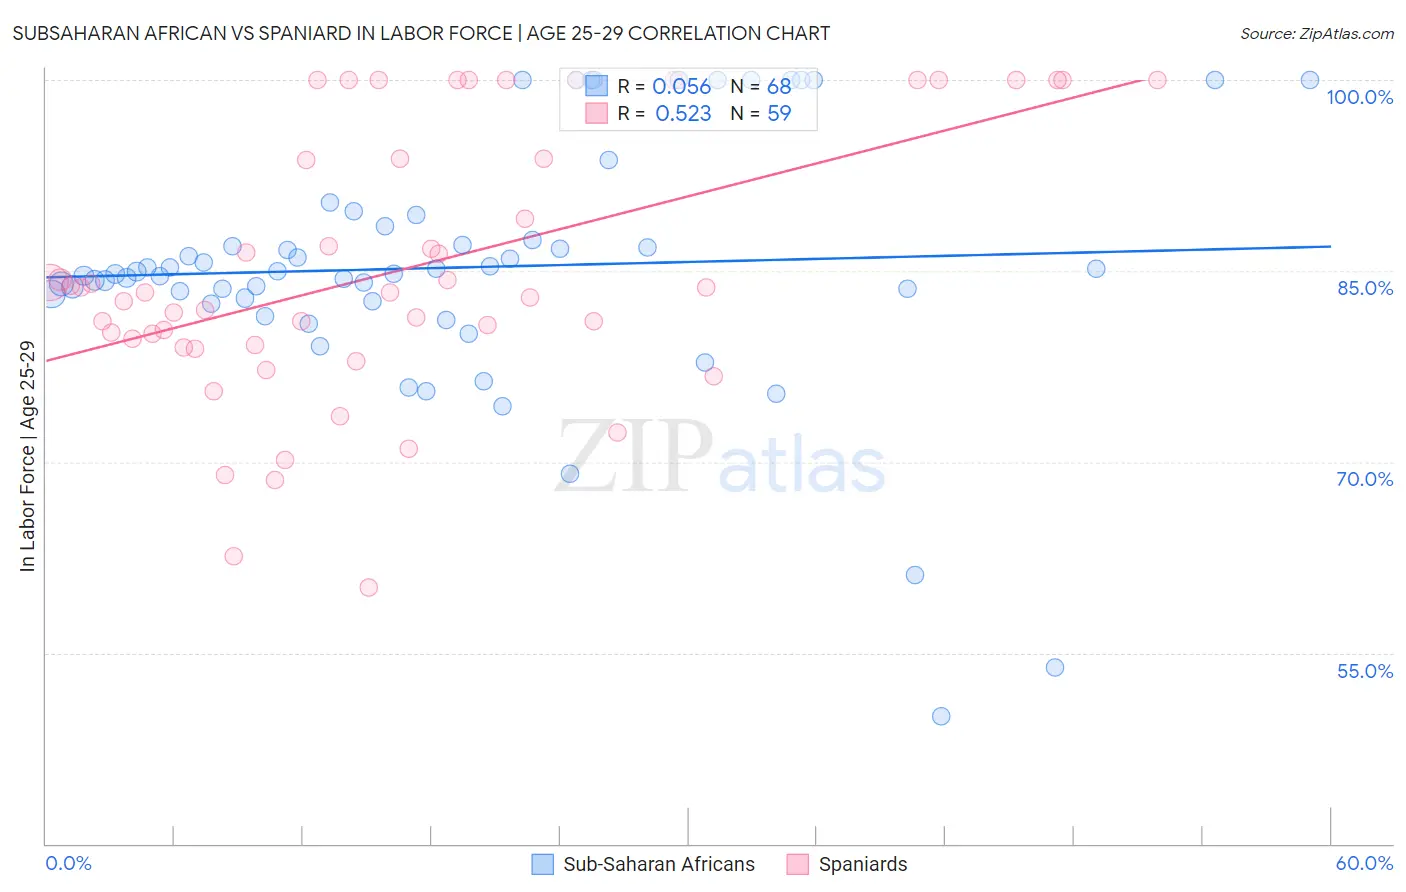
Subsaharan African vs Spaniard In Labor Force | Age 25-29 Correlation Chart
The statistical analysis conducted on geographies consisting of 507,839,893 people shows a slight positive correlation between the proportion of Sub-Saharan Africans and labor force participation rate among population between the ages 25 and 29 in the United States with a correlation coefficient (R) of 0.056 and weighted average of 84.3%. Similarly, the statistical analysis conducted on geographies consisting of 443,266,426 people shows a substantial positive correlation between the proportion of Spaniards and labor force participation rate among population between the ages 25 and 29 in the United States with a correlation coefficient (R) of 0.523 and weighted average of 83.7%, a difference of 0.78%.
In Labor Force | Age 25-29 Correlation Summary
| Measurement | Subsaharan African | Spaniard |
| Minimum | 50.0% | 60.2% |
| Maximum | 100.0% | 100.0% |
| Range | 50.0% | 39.8% |
| Mean | 85.3% | 85.1% |
| Median | 84.9% | 83.3% |
| Interquartile 25% (IQ1) | 82.7% | 79.2% |
| Interquartile 75% (IQ3) | 88.0% | 93.8% |
| Interquartile Range (IQR) | 5.2% | 14.6% |
| Standard Deviation (Sample) | 9.9% | 10.5% |
| Standard Deviation (Population) | 9.8% | 10.4% |
Similar Demographics by In Labor Force | Age 25-29
Demographics Similar to Sub-Saharan Africans by In Labor Force | Age 25-29
In terms of in labor force | age 25-29, the demographic groups most similar to Sub-Saharan Africans are Japanese (84.3%, a difference of 0.0%), Lebanese (84.3%, a difference of 0.010%), Immigrants from Jordan (84.4%, a difference of 0.020%), Chinese (84.3%, a difference of 0.020%), and Immigrants from Venezuela (84.3%, a difference of 0.020%).
| Demographics | Rating | Rank | In Labor Force | Age 25-29 |
| Ecuadorians | 14.8 /100 | #205 | Poor 84.4% |
| Immigrants | Cambodia | 14.3 /100 | #206 | Poor 84.4% |
| Immigrants | Armenia | 13.3 /100 | #207 | Poor 84.4% |
| Immigrants | Indonesia | 13.2 /100 | #208 | Poor 84.4% |
| Immigrants | Jordan | 12.8 /100 | #209 | Poor 84.4% |
| Chinese | 12.7 /100 | #210 | Poor 84.3% |
| Immigrants | Venezuela | 12.6 /100 | #211 | Poor 84.3% |
| Sub-Saharan Africans | 11.7 /100 | #212 | Poor 84.3% |
| Japanese | 11.4 /100 | #213 | Poor 84.3% |
| Lebanese | 11.1 /100 | #214 | Poor 84.3% |
| Immigrants | Syria | 10.7 /100 | #215 | Poor 84.3% |
| Israelis | 9.3 /100 | #216 | Tragic 84.3% |
| Immigrants | Ecuador | 9.3 /100 | #217 | Tragic 84.3% |
| Immigrants | Nigeria | 9.0 /100 | #218 | Tragic 84.3% |
| Immigrants | Saudi Arabia | 8.8 /100 | #219 | Tragic 84.3% |
Demographics Similar to Spaniards by In Labor Force | Age 25-29
In terms of in labor force | age 25-29, the demographic groups most similar to Spaniards are Guatemalan (83.7%, a difference of 0.0%), Immigrants from Trinidad and Tobago (83.7%, a difference of 0.0%), Bahamian (83.7%, a difference of 0.010%), Haitian (83.7%, a difference of 0.010%), and Immigrants from Haiti (83.7%, a difference of 0.020%).
| Demographics | Rating | Rank | In Labor Force | Age 25-29 |
| Immigrants | El Salvador | 0.3 /100 | #247 | Tragic 83.7% |
| Immigrants | Nonimmigrants | 0.3 /100 | #248 | Tragic 83.7% |
| Hmong | 0.3 /100 | #249 | Tragic 83.7% |
| Central Americans | 0.2 /100 | #250 | Tragic 83.7% |
| Bahamians | 0.2 /100 | #251 | Tragic 83.7% |
| Guatemalans | 0.2 /100 | #252 | Tragic 83.7% |
| Immigrants | Trinidad and Tobago | 0.2 /100 | #253 | Tragic 83.7% |
| Spaniards | 0.2 /100 | #254 | Tragic 83.7% |
| Haitians | 0.2 /100 | #255 | Tragic 83.7% |
| Immigrants | Haiti | 0.2 /100 | #256 | Tragic 83.7% |
| Delaware | 0.2 /100 | #257 | Tragic 83.7% |
| Immigrants | Guatemala | 0.1 /100 | #258 | Tragic 83.6% |
| Spanish | 0.1 /100 | #259 | Tragic 83.6% |
| Immigrants | Bahamas | 0.1 /100 | #260 | Tragic 83.6% |
| Pennsylvania Germans | 0.1 /100 | #261 | Tragic 83.6% |