Subsaharan African vs Immigrants from Denmark In Labor Force | Age 25-29
COMPARE
Subsaharan African
Immigrants from Denmark
In Labor Force | Age 25-29
In Labor Force | Age 25-29 Comparison
Sub-Saharan Africans
Immigrants from Denmark
84.3%
IN LABOR FORCE | AGE 25-29
11.7/ 100
METRIC RATING
212th/ 347
METRIC RANK
84.6%
IN LABOR FORCE | AGE 25-29
37.0/ 100
METRIC RATING
185th/ 347
METRIC RANK
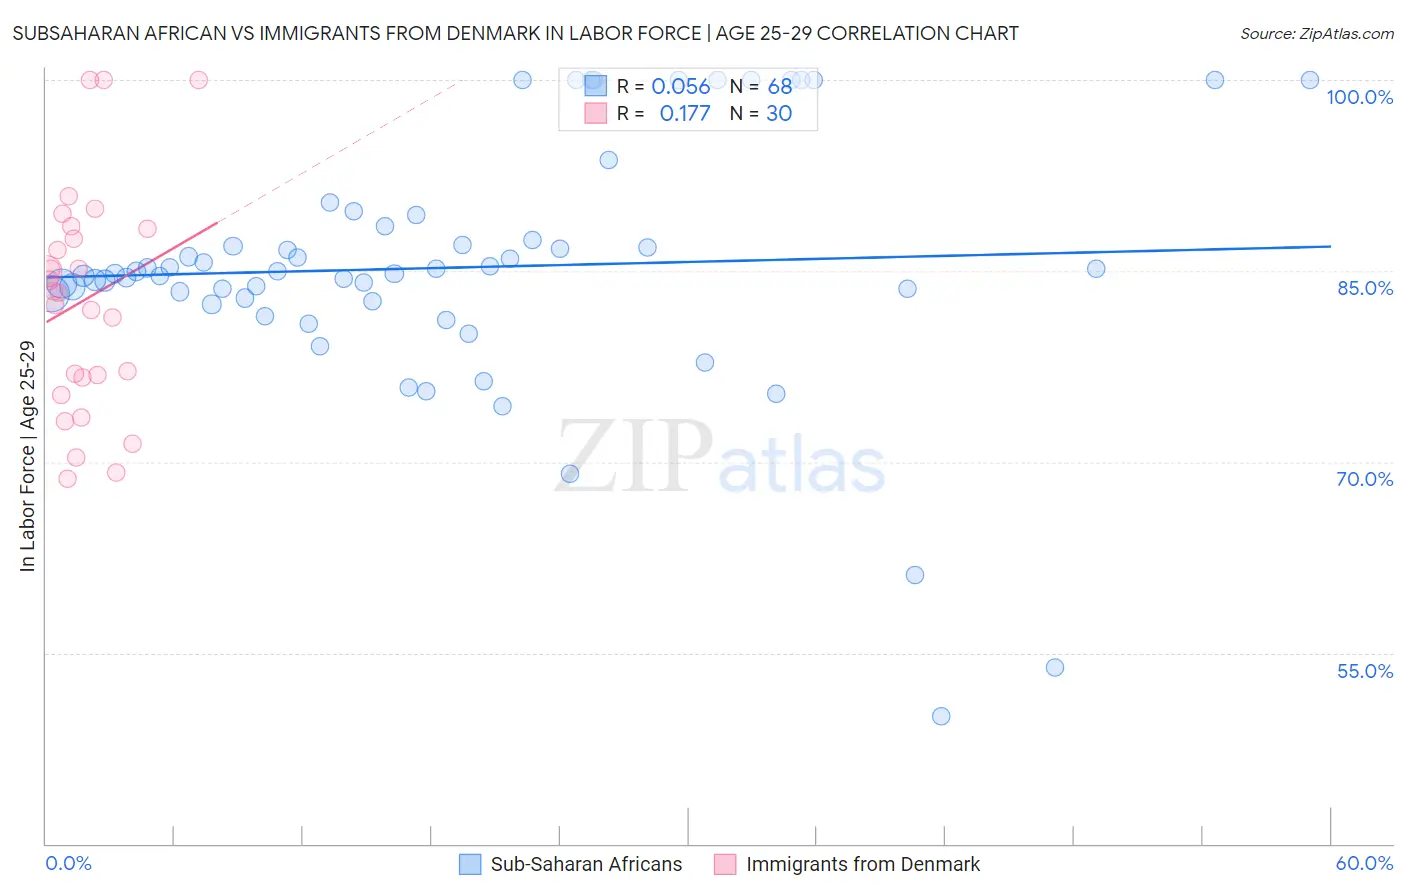
Subsaharan African vs Immigrants from Denmark In Labor Force | Age 25-29 Correlation Chart
The statistical analysis conducted on geographies consisting of 507,839,893 people shows a slight positive correlation between the proportion of Sub-Saharan Africans and labor force participation rate among population between the ages 25 and 29 in the United States with a correlation coefficient (R) of 0.056 and weighted average of 84.3%. Similarly, the statistical analysis conducted on geographies consisting of 136,409,678 people shows a poor positive correlation between the proportion of Immigrants from Denmark and labor force participation rate among population between the ages 25 and 29 in the United States with a correlation coefficient (R) of 0.177 and weighted average of 84.6%, a difference of 0.28%.
In Labor Force | Age 25-29 Correlation Summary
| Measurement | Subsaharan African | Immigrants from Denmark |
| Minimum | 50.0% | 68.7% |
| Maximum | 100.0% | 100.0% |
| Range | 50.0% | 31.3% |
| Mean | 85.3% | 82.7% |
| Median | 84.9% | 83.4% |
| Interquartile 25% (IQ1) | 82.7% | 76.6% |
| Interquartile 75% (IQ3) | 88.0% | 88.3% |
| Interquartile Range (IQR) | 5.2% | 11.7% |
| Standard Deviation (Sample) | 9.9% | 8.7% |
| Standard Deviation (Population) | 9.8% | 8.6% |
Similar Demographics by In Labor Force | Age 25-29
Demographics Similar to Sub-Saharan Africans by In Labor Force | Age 25-29
In terms of in labor force | age 25-29, the demographic groups most similar to Sub-Saharan Africans are Japanese (84.3%, a difference of 0.0%), Lebanese (84.3%, a difference of 0.010%), Immigrants from Jordan (84.4%, a difference of 0.020%), Chinese (84.3%, a difference of 0.020%), and Immigrants from Venezuela (84.3%, a difference of 0.020%).
| Demographics | Rating | Rank | In Labor Force | Age 25-29 |
| Ecuadorians | 14.8 /100 | #205 | Poor 84.4% |
| Immigrants | Cambodia | 14.3 /100 | #206 | Poor 84.4% |
| Immigrants | Armenia | 13.3 /100 | #207 | Poor 84.4% |
| Immigrants | Indonesia | 13.2 /100 | #208 | Poor 84.4% |
| Immigrants | Jordan | 12.8 /100 | #209 | Poor 84.4% |
| Chinese | 12.7 /100 | #210 | Poor 84.3% |
| Immigrants | Venezuela | 12.6 /100 | #211 | Poor 84.3% |
| Sub-Saharan Africans | 11.7 /100 | #212 | Poor 84.3% |
| Japanese | 11.4 /100 | #213 | Poor 84.3% |
| Lebanese | 11.1 /100 | #214 | Poor 84.3% |
| Immigrants | Syria | 10.7 /100 | #215 | Poor 84.3% |
| Israelis | 9.3 /100 | #216 | Tragic 84.3% |
| Immigrants | Ecuador | 9.3 /100 | #217 | Tragic 84.3% |
| Immigrants | Nigeria | 9.0 /100 | #218 | Tragic 84.3% |
| Immigrants | Saudi Arabia | 8.8 /100 | #219 | Tragic 84.3% |
Demographics Similar to Immigrants from Denmark by In Labor Force | Age 25-29
In terms of in labor force | age 25-29, the demographic groups most similar to Immigrants from Denmark are Immigrants from Kuwait (84.6%, a difference of 0.010%), Scottish (84.6%, a difference of 0.020%), Immigrants from Belgium (84.6%, a difference of 0.020%), Immigrants from Portugal (84.6%, a difference of 0.020%), and European (84.6%, a difference of 0.030%).
| Demographics | Rating | Rank | In Labor Force | Age 25-29 |
| Immigrants | Thailand | 45.2 /100 | #178 | Average 84.6% |
| Immigrants | Argentina | 44.0 /100 | #179 | Average 84.6% |
| Immigrants | South America | 42.9 /100 | #180 | Average 84.6% |
| Immigrants | Norway | 41.9 /100 | #181 | Average 84.6% |
| Europeans | 40.3 /100 | #182 | Average 84.6% |
| Scottish | 40.1 /100 | #183 | Average 84.6% |
| Immigrants | Kuwait | 38.2 /100 | #184 | Fair 84.6% |
| Immigrants | Denmark | 37.0 /100 | #185 | Fair 84.6% |
| Immigrants | Belgium | 35.0 /100 | #186 | Fair 84.6% |
| Immigrants | Portugal | 34.7 /100 | #187 | Fair 84.6% |
| Immigrants | Ukraine | 33.7 /100 | #188 | Fair 84.5% |
| Moroccans | 32.6 /100 | #189 | Fair 84.5% |
| Welsh | 31.1 /100 | #190 | Fair 84.5% |
| Zimbabweans | 28.7 /100 | #191 | Fair 84.5% |
| English | 25.8 /100 | #192 | Fair 84.5% |