Navajo vs Black/African American In Labor Force | Age 25-29
COMPARE
Navajo
Black/African American
In Labor Force | Age 25-29
In Labor Force | Age 25-29 Comparison
Navajo
Blacks/African Americans
74.6%
IN LABOR FORCE | AGE 25-29
0.0/ 100
METRIC RATING
345th/ 347
METRIC RANK
82.6%
IN LABOR FORCE | AGE 25-29
0.0/ 100
METRIC RATING
305th/ 347
METRIC RANK
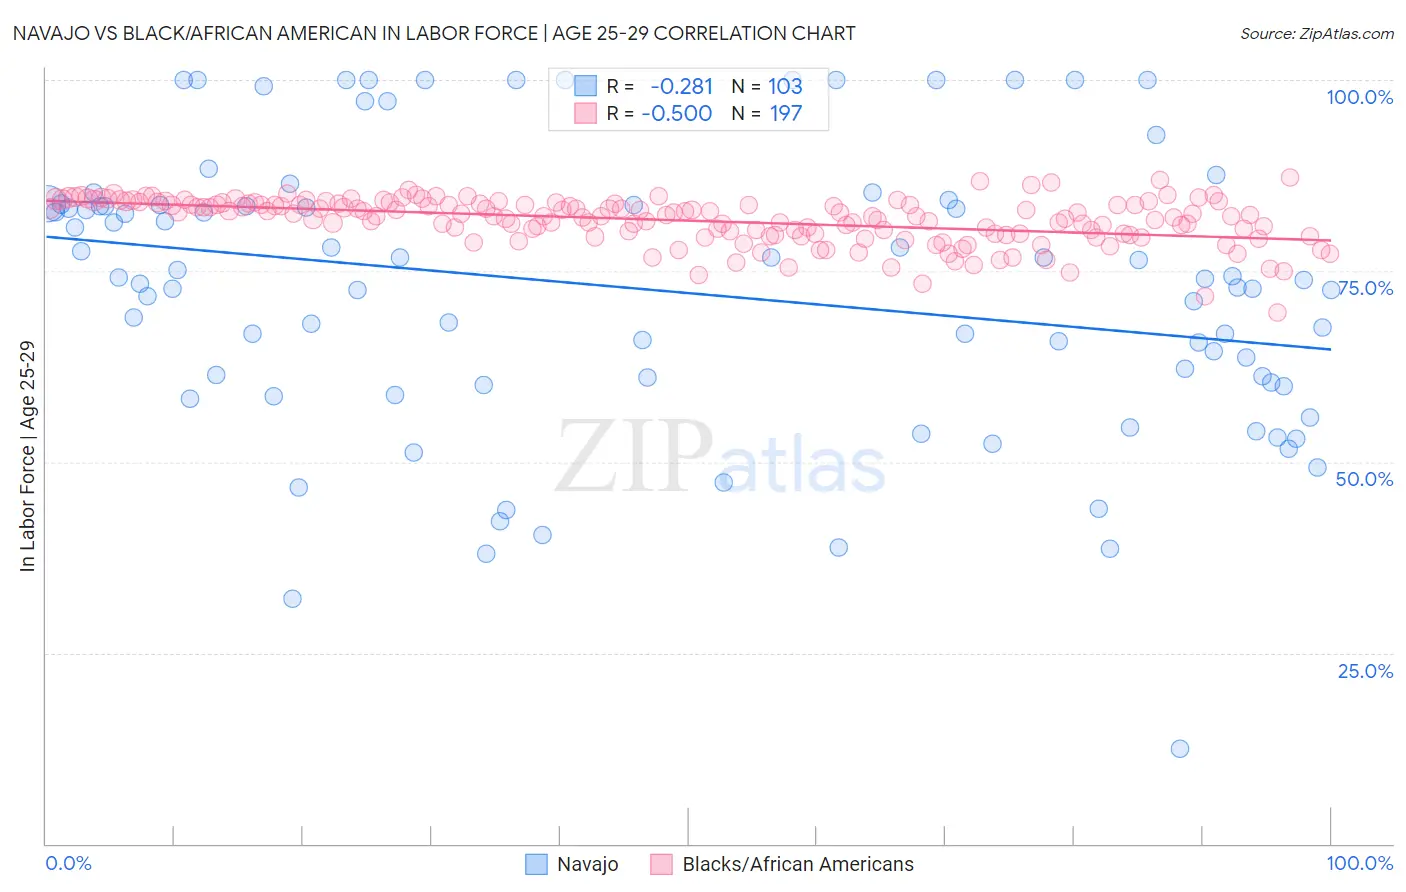
Navajo vs Black/African American In Labor Force | Age 25-29 Correlation Chart
The statistical analysis conducted on geographies consisting of 224,779,280 people shows a weak negative correlation between the proportion of Navajo and labor force participation rate among population between the ages 25 and 29 in the United States with a correlation coefficient (R) of -0.281 and weighted average of 74.6%. Similarly, the statistical analysis conducted on geographies consisting of 565,000,978 people shows a moderate negative correlation between the proportion of Blacks/African Americans and labor force participation rate among population between the ages 25 and 29 in the United States with a correlation coefficient (R) of -0.500 and weighted average of 82.6%, a difference of 10.6%.
In Labor Force | Age 25-29 Correlation Summary
| Measurement | Navajo | Black/African American |
| Minimum | 12.5% | 69.5% |
| Maximum | 100.0% | 87.2% |
| Range | 87.5% | 17.6% |
| Mean | 72.4% | 81.6% |
| Median | 73.9% | 82.3% |
| Interquartile 25% (IQ1) | 60.0% | 79.8% |
| Interquartile 75% (IQ3) | 83.7% | 83.9% |
| Interquartile Range (IQR) | 23.7% | 4.0% |
| Standard Deviation (Sample) | 18.5% | 3.0% |
| Standard Deviation (Population) | 18.4% | 3.0% |
Similar Demographics by In Labor Force | Age 25-29
Demographics Similar to Navajo by In Labor Force | Age 25-29
In terms of in labor force | age 25-29, the demographic groups most similar to Navajo are Pima (74.3%, a difference of 0.48%), Yup'ik (73.1%, a difference of 2.2%), Hopi (76.5%, a difference of 2.5%), Arapaho (76.6%, a difference of 2.6%), and Pueblo (77.5%, a difference of 3.8%).
| Demographics | Rating | Rank | In Labor Force | Age 25-29 |
| Sioux | 0.0 /100 | #333 | Tragic 79.7% |
| Yuman | 0.0 /100 | #334 | Tragic 79.3% |
| Natives/Alaskans | 0.0 /100 | #335 | Tragic 79.3% |
| Apache | 0.0 /100 | #336 | Tragic 79.2% |
| Crow | 0.0 /100 | #337 | Tragic 78.6% |
| Lumbee | 0.0 /100 | #338 | Tragic 78.3% |
| Immigrants | Yemen | 0.0 /100 | #339 | Tragic 78.2% |
| Paiute | 0.0 /100 | #340 | Tragic 78.1% |
| Tohono O'odham | 0.0 /100 | #341 | Tragic 77.5% |
| Pueblo | 0.0 /100 | #342 | Tragic 77.5% |
| Arapaho | 0.0 /100 | #343 | Tragic 76.6% |
| Hopi | 0.0 /100 | #344 | Tragic 76.5% |
| Navajo | 0.0 /100 | #345 | Tragic 74.6% |
| Pima | 0.0 /100 | #346 | Tragic 74.3% |
| Yup'ik | 0.0 /100 | #347 | Tragic 73.1% |
Demographics Similar to Blacks/African Americans by In Labor Force | Age 25-29
In terms of in labor force | age 25-29, the demographic groups most similar to Blacks/African Americans are Blackfeet (82.6%, a difference of 0.010%), Cajun (82.5%, a difference of 0.060%), Immigrants from St. Vincent and the Grenadines (82.7%, a difference of 0.12%), Central American Indian (82.4%, a difference of 0.21%), and Immigrants from Central America (82.4%, a difference of 0.22%).
| Demographics | Rating | Rank | In Labor Force | Age 25-29 |
| Native Hawaiians | 0.0 /100 | #298 | Tragic 82.9% |
| Fijians | 0.0 /100 | #299 | Tragic 82.9% |
| Spanish American Indians | 0.0 /100 | #300 | Tragic 82.9% |
| Vietnamese | 0.0 /100 | #301 | Tragic 82.8% |
| Immigrants | Belize | 0.0 /100 | #302 | Tragic 82.8% |
| Immigrants | Grenada | 0.0 /100 | #303 | Tragic 82.8% |
| Immigrants | St. Vincent and the Grenadines | 0.0 /100 | #304 | Tragic 82.7% |
| Blacks/African Americans | 0.0 /100 | #305 | Tragic 82.6% |
| Blackfeet | 0.0 /100 | #306 | Tragic 82.6% |
| Cajuns | 0.0 /100 | #307 | Tragic 82.5% |
| Central American Indians | 0.0 /100 | #308 | Tragic 82.4% |
| Immigrants | Central America | 0.0 /100 | #309 | Tragic 82.4% |
| Osage | 0.0 /100 | #310 | Tragic 82.3% |
| Alaskan Athabascans | 0.0 /100 | #311 | Tragic 82.3% |
| Hispanics or Latinos | 0.0 /100 | #312 | Tragic 82.2% |