Immigrants from Zimbabwe vs Black/African American In Labor Force | Age 25-29
COMPARE
Immigrants from Zimbabwe
Black/African American
In Labor Force | Age 25-29
In Labor Force | Age 25-29 Comparison
Immigrants from Zimbabwe
Blacks/African Americans
85.2%
IN LABOR FORCE | AGE 25-29
97.6/ 100
METRIC RATING
80th/ 347
METRIC RANK
82.6%
IN LABOR FORCE | AGE 25-29
0.0/ 100
METRIC RATING
305th/ 347
METRIC RANK
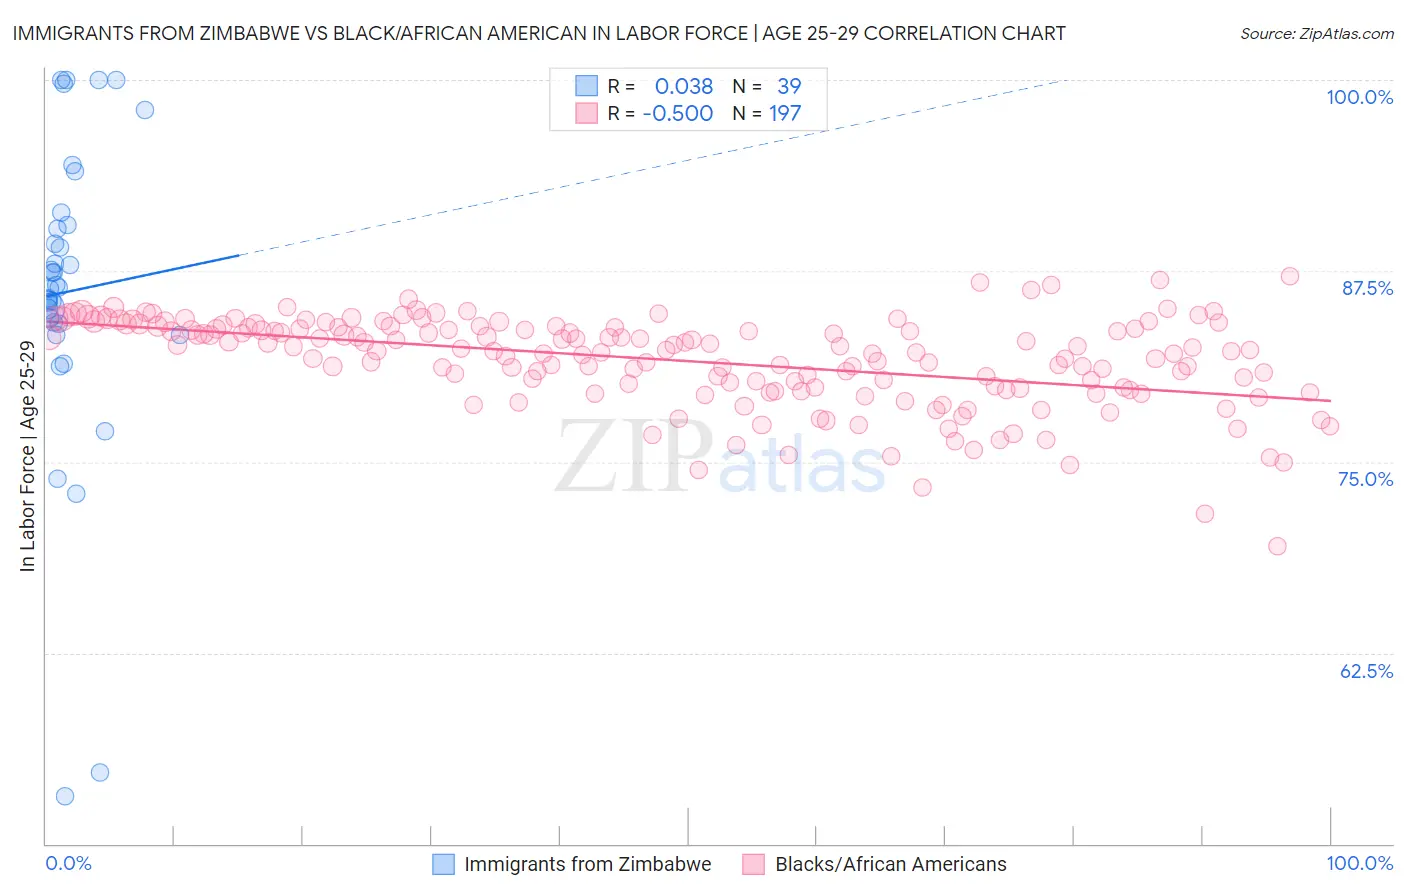
Immigrants from Zimbabwe vs Black/African American In Labor Force | Age 25-29 Correlation Chart
The statistical analysis conducted on geographies consisting of 117,801,393 people shows no correlation between the proportion of Immigrants from Zimbabwe and labor force participation rate among population between the ages 25 and 29 in the United States with a correlation coefficient (R) of 0.038 and weighted average of 85.2%. Similarly, the statistical analysis conducted on geographies consisting of 565,000,978 people shows a moderate negative correlation between the proportion of Blacks/African Americans and labor force participation rate among population between the ages 25 and 29 in the United States with a correlation coefficient (R) of -0.500 and weighted average of 82.6%, a difference of 3.2%.
In Labor Force | Age 25-29 Correlation Summary
| Measurement | Immigrants from Zimbabwe | Black/African American |
| Minimum | 53.1% | 69.5% |
| Maximum | 100.0% | 87.2% |
| Range | 46.9% | 17.6% |
| Mean | 86.2% | 81.6% |
| Median | 86.4% | 82.3% |
| Interquartile 25% (IQ1) | 84.0% | 79.8% |
| Interquartile 75% (IQ3) | 90.5% | 83.9% |
| Interquartile Range (IQR) | 6.5% | 4.0% |
| Standard Deviation (Sample) | 10.1% | 3.0% |
| Standard Deviation (Population) | 10.0% | 3.0% |
Similar Demographics by In Labor Force | Age 25-29
Demographics Similar to Immigrants from Zimbabwe by In Labor Force | Age 25-29
In terms of in labor force | age 25-29, the demographic groups most similar to Immigrants from Zimbabwe are Immigrants from Northern Africa (85.2%, a difference of 0.0%), Immigrants from Egypt (85.2%, a difference of 0.010%), Immigrants from Northern Europe (85.2%, a difference of 0.020%), Immigrants from South Central Asia (85.2%, a difference of 0.030%), and German (85.3%, a difference of 0.040%).
| Demographics | Rating | Rank | In Labor Force | Age 25-29 |
| Russians | 98.8 /100 | #73 | Exceptional 85.3% |
| Soviet Union | 98.5 /100 | #74 | Exceptional 85.3% |
| Brazilians | 98.3 /100 | #75 | Exceptional 85.3% |
| Germans | 98.1 /100 | #76 | Exceptional 85.3% |
| Immigrants | South Central Asia | 97.9 /100 | #77 | Exceptional 85.2% |
| Immigrants | Egypt | 97.7 /100 | #78 | Exceptional 85.2% |
| Immigrants | Northern Africa | 97.6 /100 | #79 | Exceptional 85.2% |
| Immigrants | Zimbabwe | 97.6 /100 | #80 | Exceptional 85.2% |
| Immigrants | Northern Europe | 97.2 /100 | #81 | Exceptional 85.2% |
| Okinawans | 97.0 /100 | #82 | Exceptional 85.2% |
| Immigrants | Europe | 96.8 /100 | #83 | Exceptional 85.2% |
| Immigrants | Eastern Europe | 96.8 /100 | #84 | Exceptional 85.2% |
| Immigrants | Africa | 96.7 /100 | #85 | Exceptional 85.2% |
| Ukrainians | 96.7 /100 | #86 | Exceptional 85.2% |
| French Canadians | 96.5 /100 | #87 | Exceptional 85.2% |
Demographics Similar to Blacks/African Americans by In Labor Force | Age 25-29
In terms of in labor force | age 25-29, the demographic groups most similar to Blacks/African Americans are Blackfeet (82.6%, a difference of 0.010%), Cajun (82.5%, a difference of 0.060%), Immigrants from St. Vincent and the Grenadines (82.7%, a difference of 0.12%), Central American Indian (82.4%, a difference of 0.21%), and Immigrants from Central America (82.4%, a difference of 0.22%).
| Demographics | Rating | Rank | In Labor Force | Age 25-29 |
| Native Hawaiians | 0.0 /100 | #298 | Tragic 82.9% |
| Fijians | 0.0 /100 | #299 | Tragic 82.9% |
| Spanish American Indians | 0.0 /100 | #300 | Tragic 82.9% |
| Vietnamese | 0.0 /100 | #301 | Tragic 82.8% |
| Immigrants | Belize | 0.0 /100 | #302 | Tragic 82.8% |
| Immigrants | Grenada | 0.0 /100 | #303 | Tragic 82.8% |
| Immigrants | St. Vincent and the Grenadines | 0.0 /100 | #304 | Tragic 82.7% |
| Blacks/African Americans | 0.0 /100 | #305 | Tragic 82.6% |
| Blackfeet | 0.0 /100 | #306 | Tragic 82.6% |
| Cajuns | 0.0 /100 | #307 | Tragic 82.5% |
| Central American Indians | 0.0 /100 | #308 | Tragic 82.4% |
| Immigrants | Central America | 0.0 /100 | #309 | Tragic 82.4% |
| Osage | 0.0 /100 | #310 | Tragic 82.3% |
| Alaskan Athabascans | 0.0 /100 | #311 | Tragic 82.3% |
| Hispanics or Latinos | 0.0 /100 | #312 | Tragic 82.2% |